A poker company assembles three different poker sets Each Ro

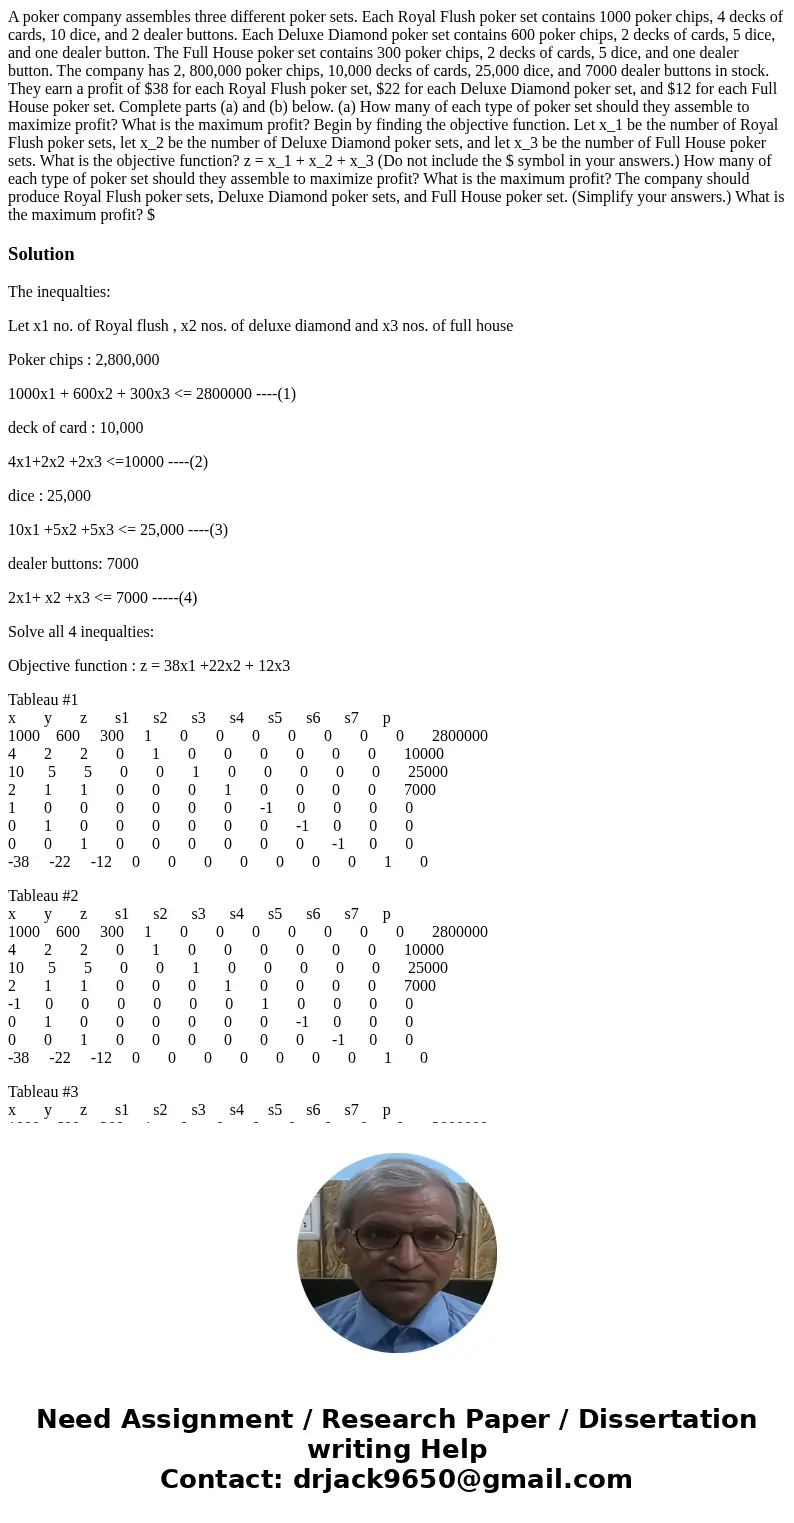
A poker company assembles three different poker sets. Each Royal Flush poker set contains 1000 poker chips, 4 decks of cards, 10 dice, and 2 dealer buttons. Each Deluxe Diamond poker set contains 600 poker chips, 2 decks of cards, 5 dice, and one dealer button. The Full House poker set contains 300 poker chips, 2 decks of cards, 5 dice, and one dealer button. The company has 2, 800,000 poker chips, 10,000 decks of cards, 25,000 dice, and 7000 dealer buttons in stock. They earn a profit of $38 for each Royal Flush poker set, $22 for each Deluxe Diamond poker set, and $12 for each Full House poker set. Complete parts (a) and (b) below. (a) How many of each type of poker set should they assemble to maximize profit? What is the maximum profit? Begin by finding the objective function. Let x_1 be the number of Royal Flush poker sets, let x_2 be the number of Deluxe Diamond poker sets, and let x_3 be the number of Full House poker sets. What is the objective function? z = x_1 + x_2 + x_3 (Do not include the $ symbol in your answers.) How many of each type of poker set should they assemble to maximize profit? What is the maximum profit? The company should produce Royal Flush poker sets, Deluxe Diamond poker sets, and Full House poker set. (Simplify your answers.) What is the maximum profit? $

Solution

The inequalties:

Let x1 no. of Royal flush , x2 nos. of deluxe diamond and x3 nos. of full house

Poker chips : 2,800,000

1000x1 + 600x2 + 300x3 <= 2800000 ----(1)

deck of card : 10,000

4x1+2x2 +2x3 <=10000 ----(2)

dice : 25,000

10x1 +5x2 +5x3 <= 25,000 ----(3)

dealer buttons: 7000

2x1+ x2 +x3 <= 7000 -----(4)

Solve all 4 inequalties:

Objective function : z = 38x1 +22x2 + 12x3

Tableau #1
x       y       z       s1      s2      s3      s4      s5      s6      s7      p             
1000    600     300     1       0       0       0       0       0       0       0       2800000
4       2       2       0       1       0       0       0       0       0       0       10000
10      5       5       0       0       1       0       0       0       0       0       25000
2       1       1       0       0       0       1       0       0       0       0       7000  
1       0       0       0       0       0       0       -1      0       0       0       0     
0       1       0       0       0       0       0       0       -1      0       0       0     
0       0       1       0       0       0       0       0       0       -1      0       0     
-38     -22     -12     0       0       0       0       0       0       0       1       0     

Tableau #2
x       y       z       s1      s2      s3      s4      s5      s6      s7      p             
1000    600     300     1       0       0       0       0       0       0       0       2800000
4       2       2       0       1       0       0       0       0       0       0       10000
10      5       5       0       0       1       0       0       0       0       0       25000
2       1       1       0       0       0       1       0       0       0       0       7000  
-1      0       0       0       0       0       0       1       0       0       0       0     
0       1       0       0       0       0       0       0       -1      0       0       0     
0       0       1       0       0       0       0       0       0       -1      0       0     
-38     -22     -12     0       0       0       0       0       0       0       1       0     

Tableau #3
x       y       z       s1      s2      s3      s4      s5      s6      s7      p             
1000    600     300     1       0       0       0       0       0       0       0       2800000
4       2       2       0       1       0       0       0       0       0       0       10000
10      5       5       0       0       1       0       0       0       0       0       25000
2       1       1       0       0       0       1       0       0       0       0       7000  
-1      0       0       0       0       0       0       1       0       0       0       0     
0       -1      0       0       0       0       0       0       1       0       0       0     
0       0       1       0       0       0       0       0       0       -1      0       0     
-38     -22     -12     0       0       0       0       0       0       0       1       0     

Tableau #4
x       y       z       s1      s2      s3      s4      s5      s6      s7      p             
1000    600     300     1       0       0       0       0       0       0       0       2800000
4       2       2       0       1       0       0       0       0       0       0       10000
10      5       5       0       0       1       0       0       0       0       0       25000
2       1       1       0       0       0       1       0       0       0       0       7000  
-1      0       0       0       0       0       0       1       0       0       0       0     
0       -1      0       0       0       0       0       0       1       0       0       0     
0       0       -1      0       0       0       0       0       0       1       0       0     
-38     -22     -12     0       0       0       0       0       0       0       1       0     

Tableau #5
x      y      z      s1     s2     s3     s4     s5     s6     s7     p           
0      100    -200   1      -250   0      0      0      0      0      0      300000
1      0.5    0.5    0      0.25   0      0      0      0      0      0      2500
0      0      0      0      -2.5   1      0      0      0      0      0      0    
0      0      0      0      -0.5   0      1      0      0      0      0      2000
0      0.5    0.5    0      0.25   0      0      1      0      0      0      2500
0      -1     0      0      0      0      0      0      1      0      0      0    
0      0      -1     0      0      0      0      0      0      1      0      0    
0      -3     7      0      9.5    0      0      0      0      0      1      95000

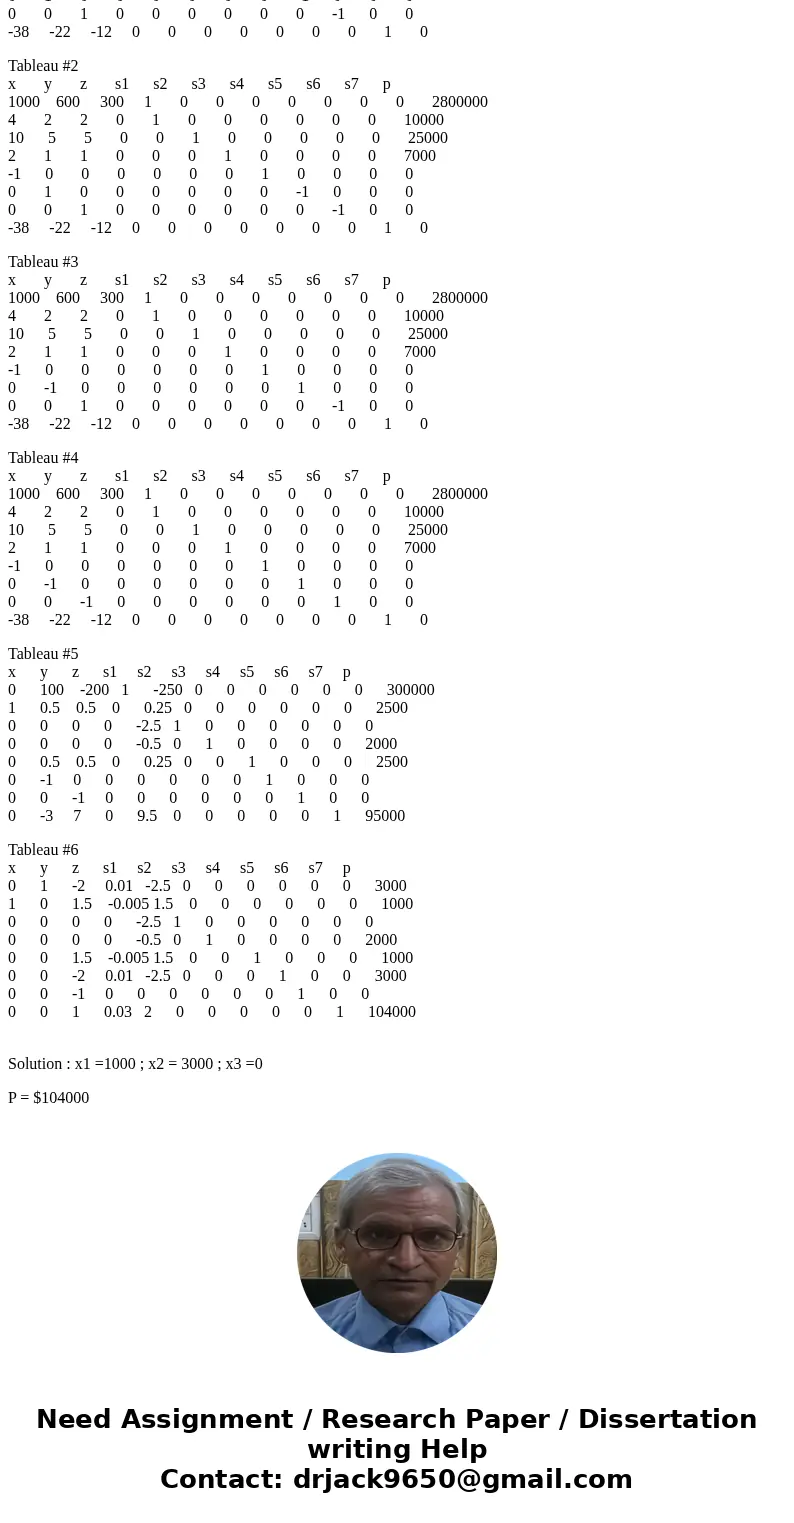
Tableau #6
x      y      z      s1     s2     s3     s4     s5     s6     s7     p           
0      1      -2     0.01   -2.5   0      0      0      0      0      0      3000
1      0      1.5    -0.005 1.5    0      0      0      0      0      0      1000
0      0      0      0      -2.5   1      0      0      0      0      0      0    
0      0      0      0      -0.5   0      1      0      0      0      0      2000
0      0      1.5    -0.005 1.5    0      0      1      0      0      0      1000
0      0      -2     0.01   -2.5   0      0      0      1      0      0      3000
0      0      -1     0      0      0      0      0      0      1      0      0    
0      0      1      0.03   2      0      0      0      0      0      1      104000


Solution : x1 =1000 ; x2 = 3000 ; x3 =0

P = $104000
 A poker company assembles three different poker sets. Each Royal Flush poker set contains 1000 poker chips, 4 decks of cards, 10 dice, and 2 dealer buttons. Ea
 A poker company assembles three different poker sets. Each Royal Flush poker set contains 1000 poker chips, 4 decks of cards, 10 dice, and 2 dealer buttons. Ea

Get Help Now

Submit a Take Down Notice

Tutor
Tutor: Dr Jack
Most rated tutor on our site