Exercise 137 Liquidity analysis LO P3 Simon Companys yearend
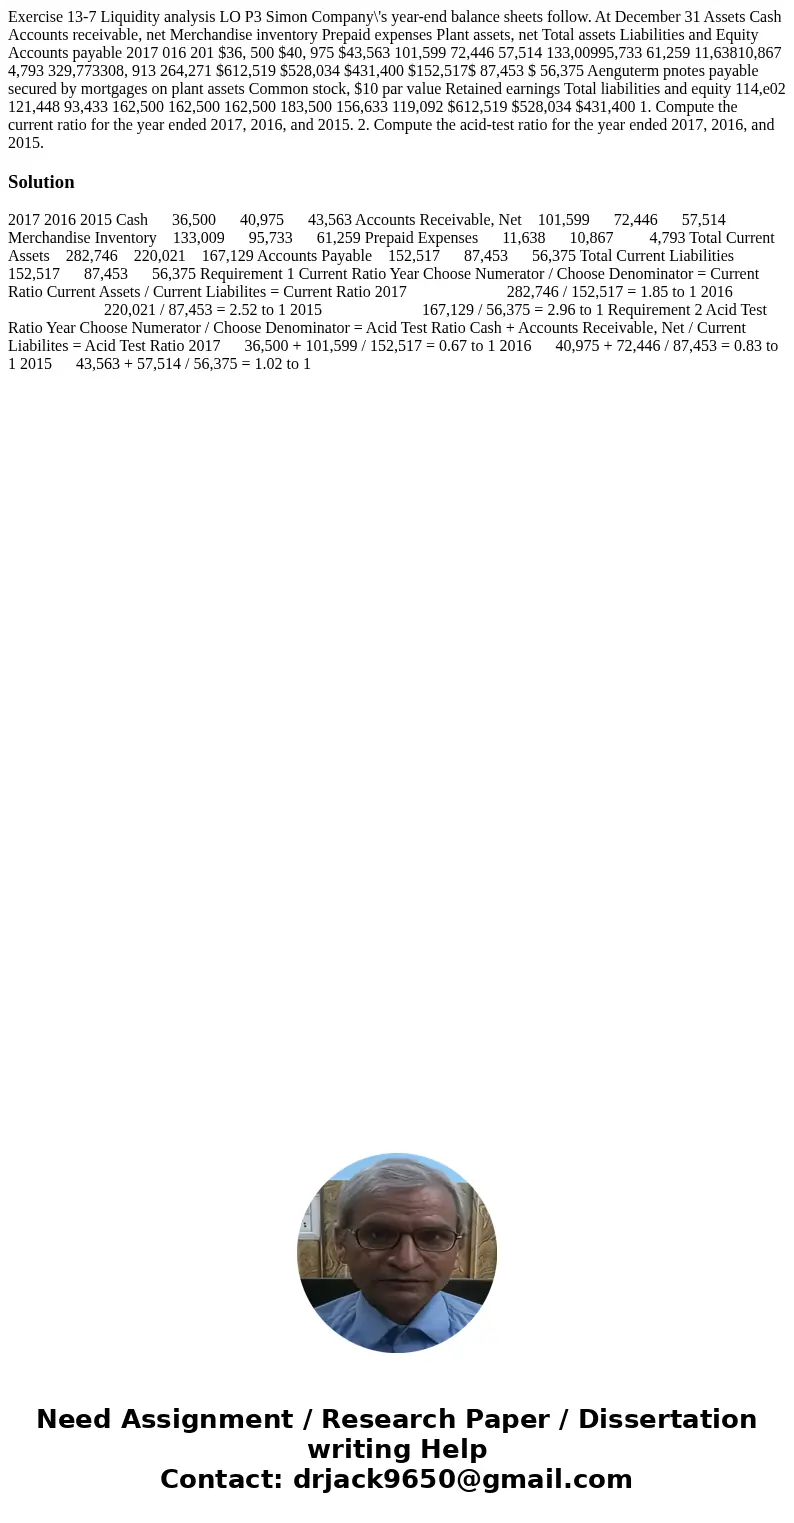
Exercise 13-7 Liquidity analysis LO P3 Simon Company\'s year-end balance sheets follow. At December 31 Assets Cash Accounts receivable, net Merchandise inventory Prepaid expenses Plant assets, net Total assets Liabilities and Equity Accounts payable 2017 016 201 $36, 500 $40, 975 $43,563 101,599 72,446 57,514 133,00995,733 61,259 11,63810,867 4,793 329,773308, 913 264,271 $612,519 $528,034 $431,400 $152,517$ 87,453 $ 56,375 Aenguterm pnotes payable secured by mortgages on plant assets Common stock, $10 par value Retained earnings Total liabilities and equity 114,e02 121,448 93,433 162,500 162,500 162,500 183,500 156,633 119,092 $612,519 $528,034 $431,400 1. Compute the current ratio for the year ended 2017, 2016, and 2015. 2. Compute the acid-test ratio for the year ended 2017, 2016, and 2015. 
Solution
2017 2016 2015 Cash 36,500 40,975 43,563 Accounts Receivable, Net 101,599 72,446 57,514 Merchandise Inventory 133,009 95,733 61,259 Prepaid Expenses 11,638 10,867 4,793 Total Current Assets 282,746 220,021 167,129 Accounts Payable 152,517 87,453 56,375 Total Current Liabilities 152,517 87,453 56,375 Requirement 1 Current Ratio Year Choose Numerator / Choose Denominator = Current Ratio Current Assets / Current Liabilites = Current Ratio 2017 282,746 / 152,517 = 1.85 to 1 2016 220,021 / 87,453 = 2.52 to 1 2015 167,129 / 56,375 = 2.96 to 1 Requirement 2 Acid Test Ratio Year Choose Numerator / Choose Denominator = Acid Test Ratio Cash + Accounts Receivable, Net / Current Liabilites = Acid Test Ratio 2017 36,500 + 101,599 / 152,517 = 0.67 to 1 2016 40,975 + 72,446 / 87,453 = 0.83 to 1 2015 43,563 + 57,514 / 56,375 = 1.02 to 1
 Homework Sourse