2 St Matthews is a small hospital in Youngstown OH The hospi
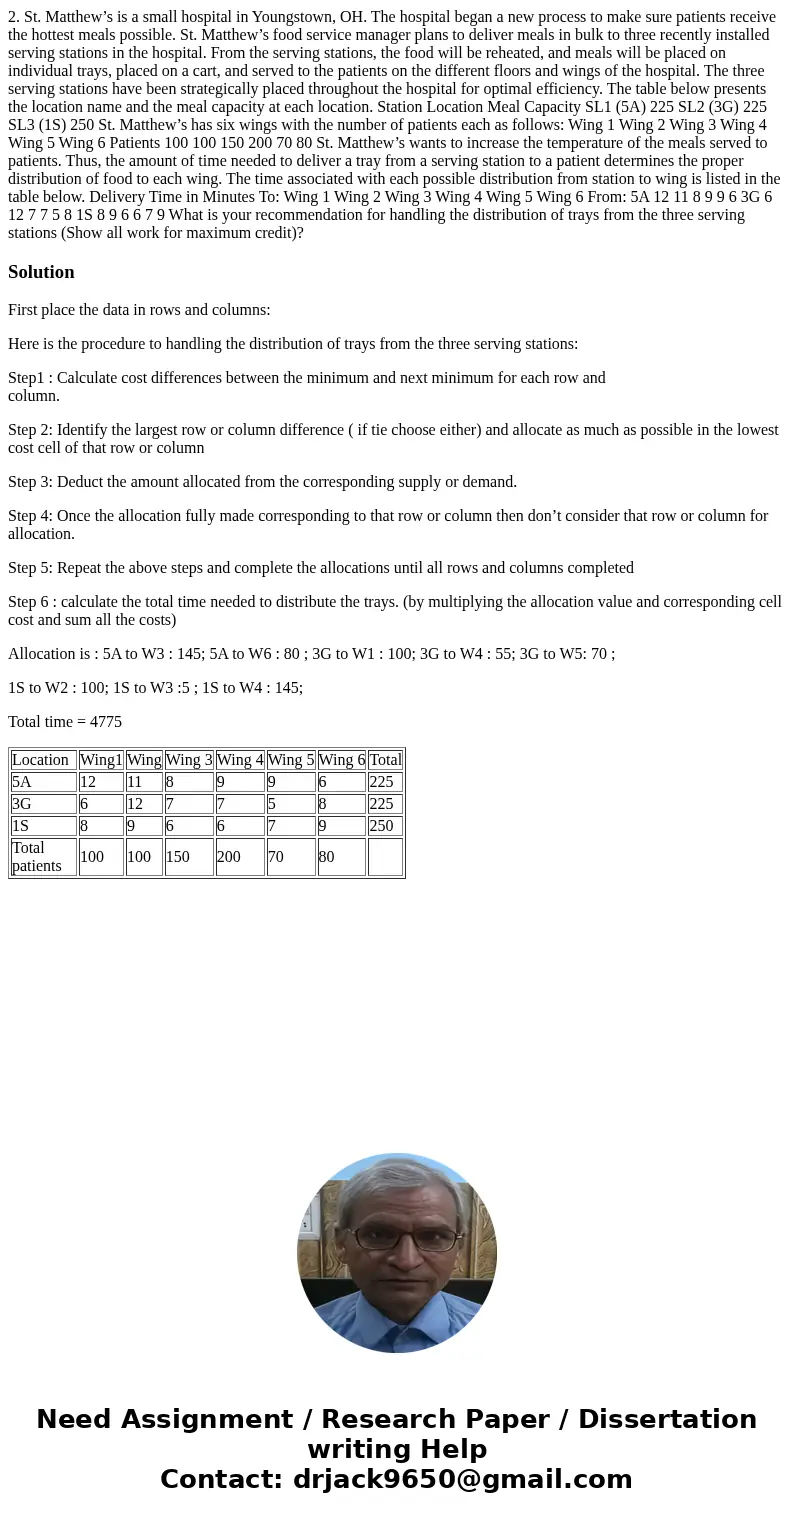
2. St. Matthew’s is a small hospital in Youngstown, OH. The hospital began a new process to make sure patients receive the hottest meals possible. St. Matthew’s food service manager plans to deliver meals in bulk to three recently installed serving stations in the hospital. From the serving stations, the food will be reheated, and meals will be placed on individual trays, placed on a cart, and served to the patients on the different floors and wings of the hospital. The three serving stations have been strategically placed throughout the hospital for optimal efficiency. The table below presents the location name and the meal capacity at each location. Station Location Meal Capacity SL1 (5A) 225 SL2 (3G) 225 SL3 (1S) 250 St. Matthew’s has six wings with the number of patients each as follows: Wing 1 Wing 2 Wing 3 Wing 4 Wing 5 Wing 6 Patients 100 100 150 200 70 80 St. Matthew’s wants to increase the temperature of the meals served to patients. Thus, the amount of time needed to deliver a tray from a serving station to a patient determines the proper distribution of food to each wing. The time associated with each possible distribution from station to wing is listed in the table below. Delivery Time in Minutes To: Wing 1 Wing 2 Wing 3 Wing 4 Wing 5 Wing 6 From: 5A 12 11 8 9 9 6 3G 6 12 7 7 5 8 1S 8 9 6 6 7 9 What is your recommendation for handling the distribution of trays from the three serving stations (Show all work for maximum credit)?
Solution
First place the data in rows and columns:
Here is the procedure to handling the distribution of trays from the three serving stations:
Step1 : Calculate cost differences between the minimum and next minimum for each row and column.
Step 2: Identify the largest row or column difference ( if tie choose either) and allocate as much as possible in the lowest cost cell of that row or column
Step 3: Deduct the amount allocated from the corresponding supply or demand.
Step 4: Once the allocation fully made corresponding to that row or column then don’t consider that row or column for allocation.
Step 5: Repeat the above steps and complete the allocations until all rows and columns completed
Step 6 : calculate the total time needed to distribute the trays. (by multiplying the allocation value and corresponding cell cost and sum all the costs)
Allocation is : 5A to W3 : 145; 5A to W6 : 80 ; 3G to W1 : 100; 3G to W4 : 55; 3G to W5: 70 ;
1S to W2 : 100; 1S to W3 :5 ; 1S to W4 : 145;
Total time = 4775
| Location | Wing1 | Wing | Wing 3 | Wing 4 | Wing 5 | Wing 6 | Total |
| 5A | 12 | 11 | 8 | 9 | 9 | 6 | 225 |
| 3G | 6 | 12 | 7 | 7 | 5 | 8 | 225 |
| 1S | 8 | 9 | 6 | 6 | 7 | 9 | 250 |
| Total patients | 100 | 100 | 150 | 200 | 70 | 80 |

 Homework Sourse