uicblackboardcom 00 Statistics and Probability question Lect
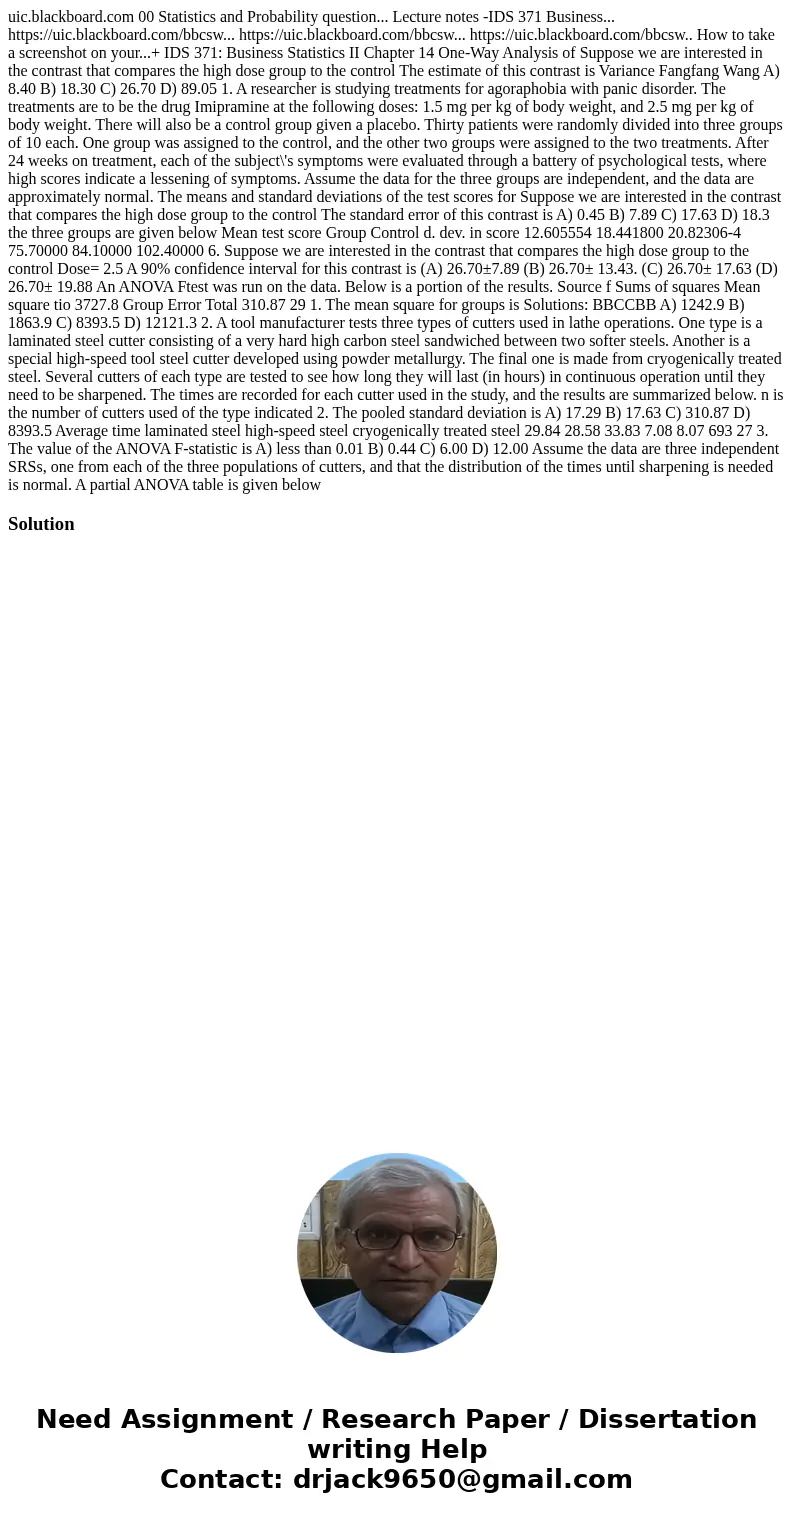
uic.blackboard.com 00 Statistics and Probability question... Lecture notes -IDS 371 Business... https://uic.blackboard.com/bbcsw... https://uic.blackboard.com/bbcsw... https://uic.blackboard.com/bbcsw.. How to take a screenshot on your...+ IDS 371: Business Statistics II Chapter 14 One-Way Analysis of Suppose we are interested in the contrast that compares the high dose group to the control The estimate of this contrast is Variance Fangfang Wang A) 8.40 B) 18.30 C) 26.70 D) 89.05 1. A researcher is studying treatments for agoraphobia with panic disorder. The treatments are to be the drug Imipramine at the following doses: 1.5 mg per kg of body weight, and 2.5 mg per kg of body weight. There will also be a control group given a placebo. Thirty patients were randomly divided into three groups of 10 each. One group was assigned to the control, and the other two groups were assigned to the two treatments. After 24 weeks on treatment, each of the subject\'s symptoms were evaluated through a battery of psychological tests, where high scores indicate a lessening of symptoms. Assume the data for the three groups are independent, and the data are approximately normal. The means and standard deviations of the test scores for Suppose we are interested in the contrast that compares the high dose group to the control The standard error of this contrast is A) 0.45 B) 7.89 C) 17.63 D) 18.3 the three groups are given below Mean test score Group Control d. dev. in score 12.605554 18.441800 20.82306-4 75.70000 84.10000 102.40000 6. Suppose we are interested in the contrast that compares the high dose group to the control Dose= 2.5 A 90% confidence interval for this contrast is (A) 26.70±7.89 (B) 26.70± 13.43. (C) 26.70± 17.63 (D) 26.70± 19.88 An ANOVA Ftest was run on the data. Below is a portion of the results. Source f Sums of squares Mean square tio 3727.8 Group Error Total 310.87 29 1. The mean square for groups is Solutions: BBCCBB A) 1242.9 B) 1863.9 C) 8393.5 D) 12121.3 2. A tool manufacturer tests three types of cutters used in lathe operations. One type is a laminated steel cutter consisting of a very hard high carbon steel sandwiched between two softer steels. Another is a special high-speed tool steel cutter developed using powder metallurgy. The final one is made from cryogenically treated steel. Several cutters of each type are tested to see how long they will last (in hours) in continuous operation until they need to be sharpened. The times are recorded for each cutter used in the study, and the results are summarized below. n is the number of cutters used of the type indicated 2. The pooled standard deviation is A) 17.29 B) 17.63 C) 310.87 D) 8393.5 Average time laminated steel high-speed steel cryogenically treated steel 29.84 28.58 33.83 7.08 8.07 693 27 3. The value of the ANOVA F-statistic is A) less than 0.01 B) 0.44 C) 6.00 D) 12.00 Assume the data are three independent SRSs, one from each of the three populations of cutters, and that the distribution of the times until sharpening is needed is normal. A partial ANOVA table is given below 
Solution

 Homework Sourse