The following table shows US employment figures for August 2
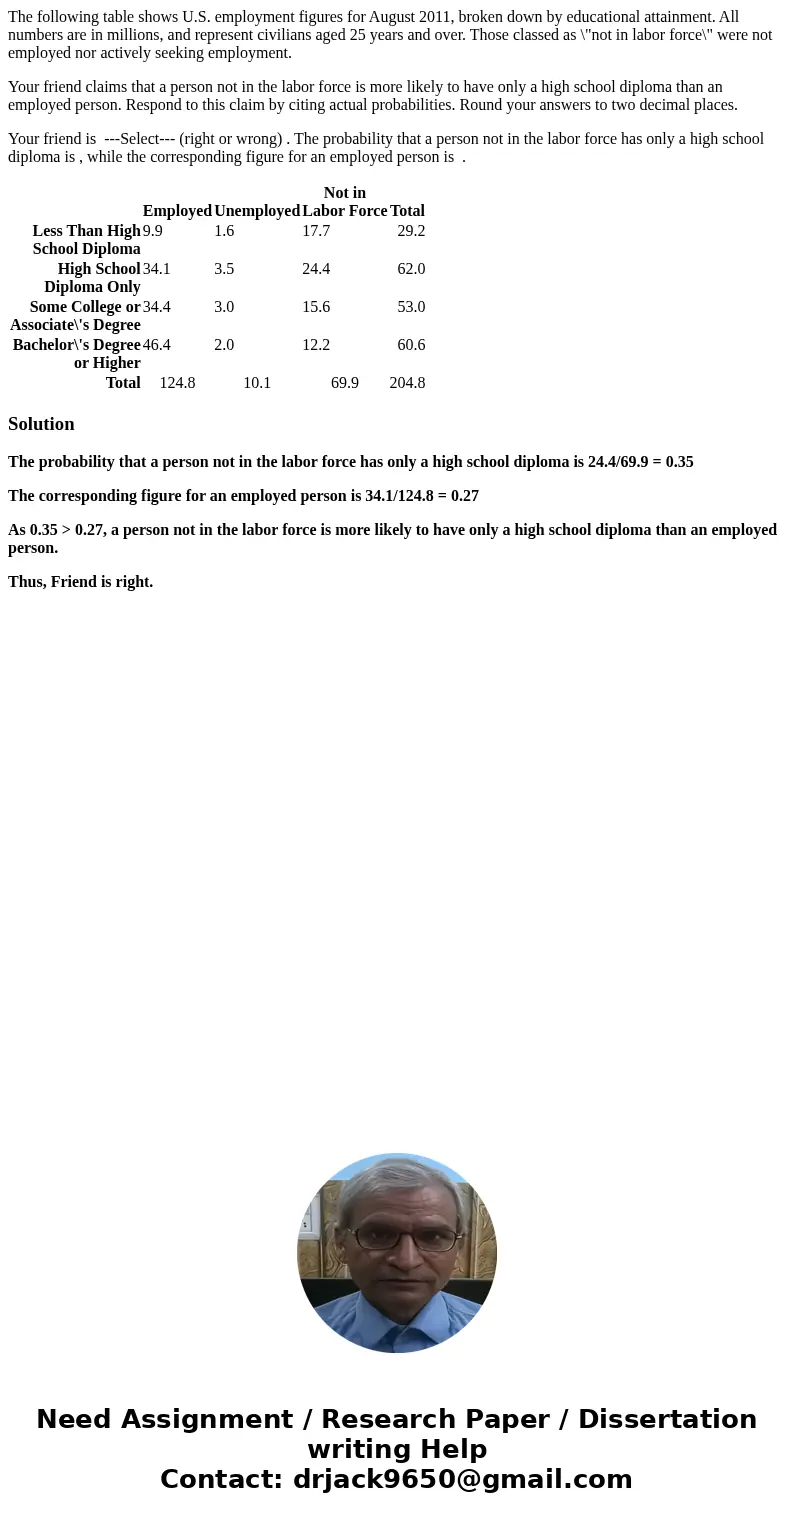
The following table shows U.S. employment figures for August 2011, broken down by educational attainment. All numbers are in millions, and represent civilians aged 25 years and over. Those classed as \"not in labor force\" were not employed nor actively seeking employment.
Your friend claims that a person not in the labor force is more likely to have only a high school diploma than an employed person. Respond to this claim by citing actual probabilities. Round your answers to two decimal places.
Your friend is ---Select--- (right or wrong) . The probability that a person not in the labor force has only a high school diploma is , while the corresponding figure for an employed person is .
| Employed | Unemployed | Not in Labor Force | Total | |
|---|---|---|---|---|
| Less Than High School Diploma | 9.9 | 1.6 | 17.7 | 29.2 |
| High School Diploma Only | 34.1 | 3.5 | 24.4 | 62.0 |
| Some College or Associate\'s Degree | 34.4 | 3.0 | 15.6 | 53.0 |
| Bachelor\'s Degree or Higher | 46.4 | 2.0 | 12.2 | 60.6 |
| Total | 124.8 | 10.1 | 69.9 | 204.8 |
Solution
The probability that a person not in the labor force has only a high school diploma is 24.4/69.9 = 0.35
The corresponding figure for an employed person is 34.1/124.8 = 0.27
As 0.35 > 0.27, a person not in the labor force is more likely to have only a high school diploma than an employed person.
Thus, Friend is right.

 Homework Sourse