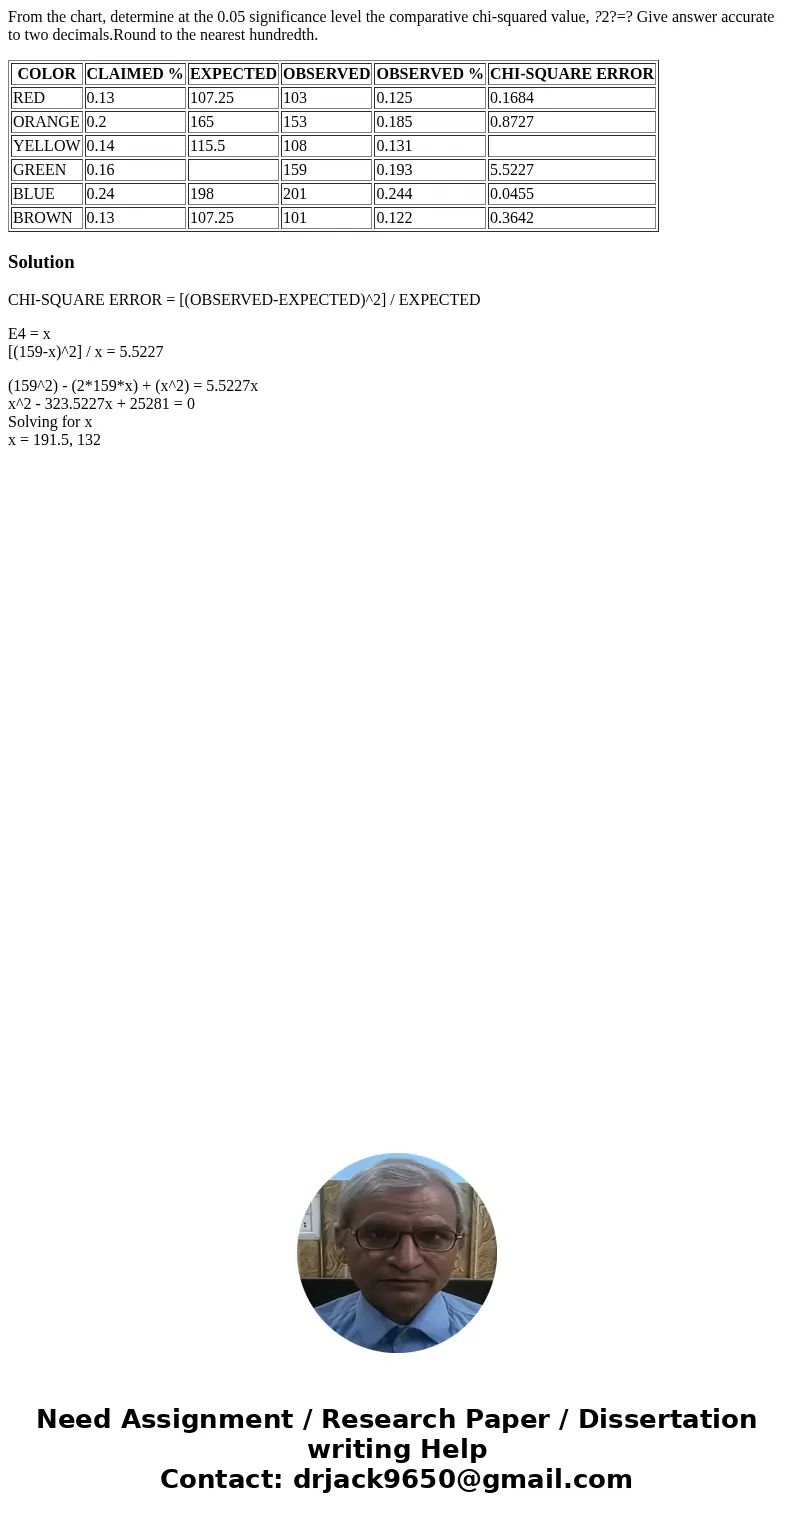
From the chart determine at the 005 significance level the c
From the chart, determine at the 0.05 significance level the comparative chi-squared value, ?2?=? Give answer accurate to two decimals.Round to the nearest hundredth.
| COLOR | CLAIMED % | EXPECTED | OBSERVED | OBSERVED % | CHI-SQUARE ERROR |
|---|---|---|---|---|---|
| RED | 0.13 | 107.25 | 103 | 0.125 | 0.1684 |
| ORANGE | 0.2 | 165 | 153 | 0.185 | 0.8727 |
| YELLOW | 0.14 | 115.5 | 108 | 0.131 | |
| GREEN | 0.16 | 159 | 0.193 | 5.5227 | |
| BLUE | 0.24 | 198 | 201 | 0.244 | 0.0455 |
| BROWN | 0.13 | 107.25 | 101 | 0.122 | 0.3642 |
Solution
CHI-SQUARE ERROR = [(OBSERVED-EXPECTED)^2] / EXPECTED
E4 = x
[(159-x)^2] / x = 5.5227
(159^2) - (2*159*x) + (x^2) = 5.5227x
x^2 - 323.5227x + 25281 = 0
Solving for x
x = 191.5, 132

 Homework Sourse