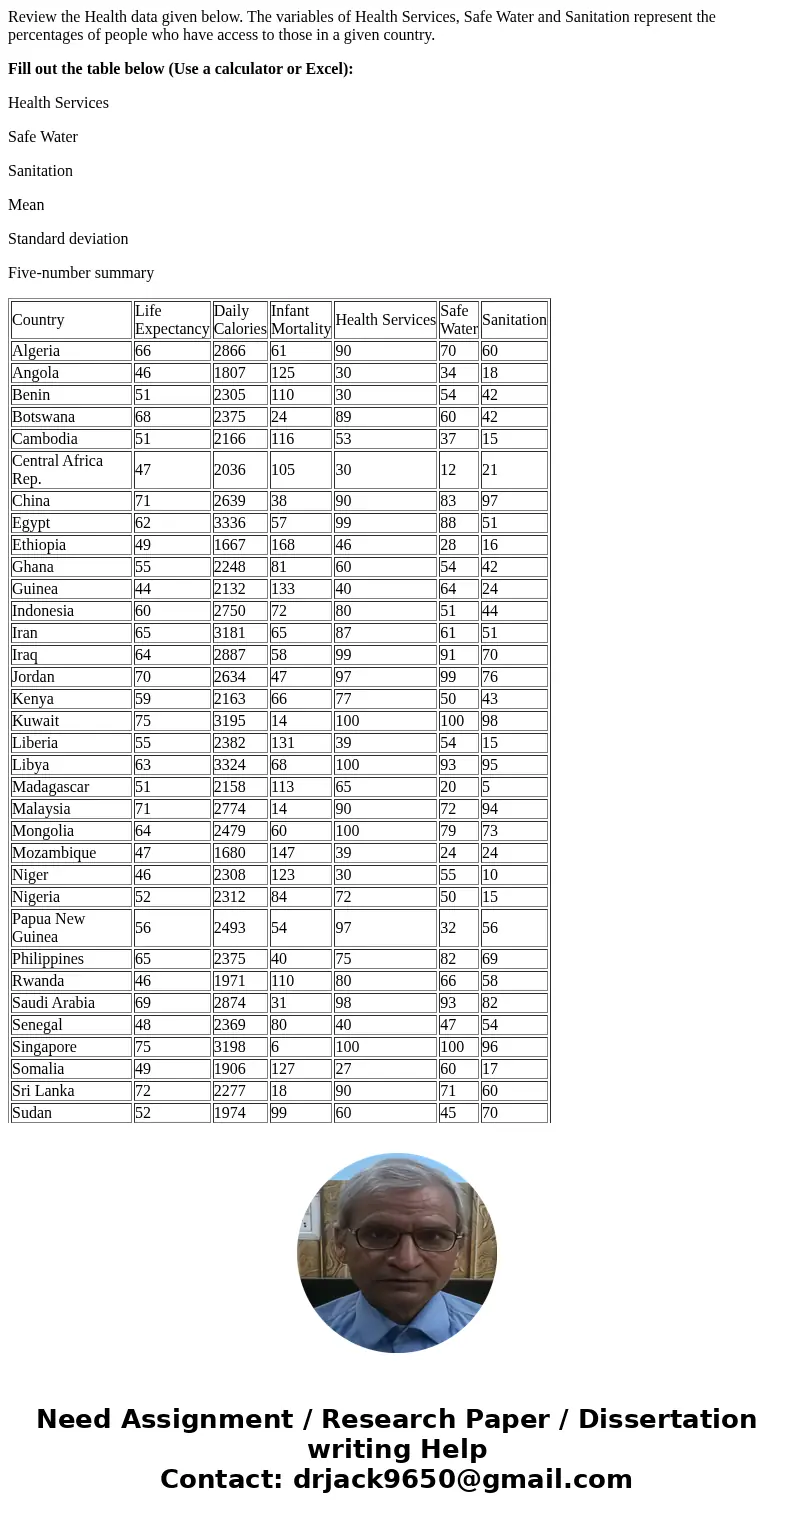
Review the Health data given below The variables of Health S
Review the Health data given below. The variables of Health Services, Safe Water and Sanitation represent the percentages of people who have access to those in a given country.
Fill out the table below (Use a calculator or Excel):
Health Services
Safe Water
Sanitation
Mean
Standard deviation
Five-number summary
| Country | Life Expectancy | Daily Calories | Infant Mortality | Health Services | Safe Water | Sanitation |
| Algeria | 66 | 2866 | 61 | 90 | 70 | 60 |
| Angola | 46 | 1807 | 125 | 30 | 34 | 18 |
| Benin | 51 | 2305 | 110 | 30 | 54 | 42 |
| Botswana | 68 | 2375 | 24 | 89 | 60 | 42 |
| Cambodia | 51 | 2166 | 116 | 53 | 37 | 15 |
| Central Africa Rep. | 47 | 2036 | 105 | 30 | 12 | 21 |
| China | 71 | 2639 | 38 | 90 | 83 | 97 |
| Egypt | 62 | 3336 | 57 | 99 | 88 | 51 |
| Ethiopia | 49 | 1667 | 168 | 46 | 28 | 16 |
| Ghana | 55 | 2248 | 81 | 60 | 54 | 42 |
| Guinea | 44 | 2132 | 133 | 40 | 64 | 24 |
| Indonesia | 60 | 2750 | 72 | 80 | 51 | 44 |
| Iran | 65 | 3181 | 65 | 87 | 61 | 51 |
| Iraq | 64 | 2887 | 58 | 99 | 91 | 70 |
| Jordan | 70 | 2634 | 47 | 97 | 99 | 76 |
| Kenya | 59 | 2163 | 66 | 77 | 50 | 43 |
| Kuwait | 75 | 3195 | 14 | 100 | 100 | 98 |
| Liberia | 55 | 2382 | 131 | 39 | 54 | 15 |
| Libya | 63 | 3324 | 68 | 100 | 93 | 95 |
| Madagascar | 51 | 2158 | 113 | 65 | 20 | 5 |
| Malaysia | 71 | 2774 | 14 | 90 | 72 | 94 |
| Mongolia | 64 | 2479 | 60 | 100 | 79 | 73 |
| Mozambique | 47 | 1680 | 147 | 39 | 24 | 24 |
| Niger | 46 | 2308 | 123 | 30 | 55 | 10 |
| Nigeria | 52 | 2312 | 84 | 72 | 50 | 15 |
| Papua New Guinea | 56 | 2493 | 54 | 97 | 32 | 56 |
| Philippines | 65 | 2375 | 40 | 75 | 82 | 69 |
| Rwanda | 46 | 1971 | 110 | 80 | 66 | 58 |
| Saudi Arabia | 69 | 2874 | 31 | 98 | 93 | 82 |
| Senegal | 48 | 2369 | 80 | 40 | 47 | 54 |
| Singapore | 75 | 3198 | 6 | 100 | 100 | 96 |
| Somalia | 49 | 1906 | 127 | 27 | 60 | 17 |
| Sri Lanka | 72 | 2277 | 18 | 90 | 71 | 60 |
| Sudan | 52 | 1974 | 99 | 60 | 45 | 70 |
| Tanzania | 51 | 2206 | 115 | 80 | 51 | 66 |
| Thailand | 69 | 2316 | 26 | 70 | 76 | 74 |
| Togo | 54 | 2214 | 85 | 60 | 59 | 21 |
| Zaire | 52 | 1991 | 91 | 40 | 33 | 25 |
| Zambia | 48 | 2077 | 108 | 74 | 48 | 43 |
| Zimbabwe | 60 | 2299 | 47 | 83 | 36 | 42 |
Solution
Following is the completed table:
| Health Services | Safe Water | Sanitation | |
| Mean | 70.15 | 59.55 | 49.35 |
| Standard deviation | 25.01133 | 23.33474 | 27.61043 |
| Five-number summary | 27 | 12 | 5 |
| 44.5 | 46.5 | 23.25 | |
| 76 | 57 | 47.5 | |
| 90 | 76.75 | 70 | |
| 100 | 100 | 98 |


 Homework Sourse