Question 2 A realtor wants to compare the average salestoapp
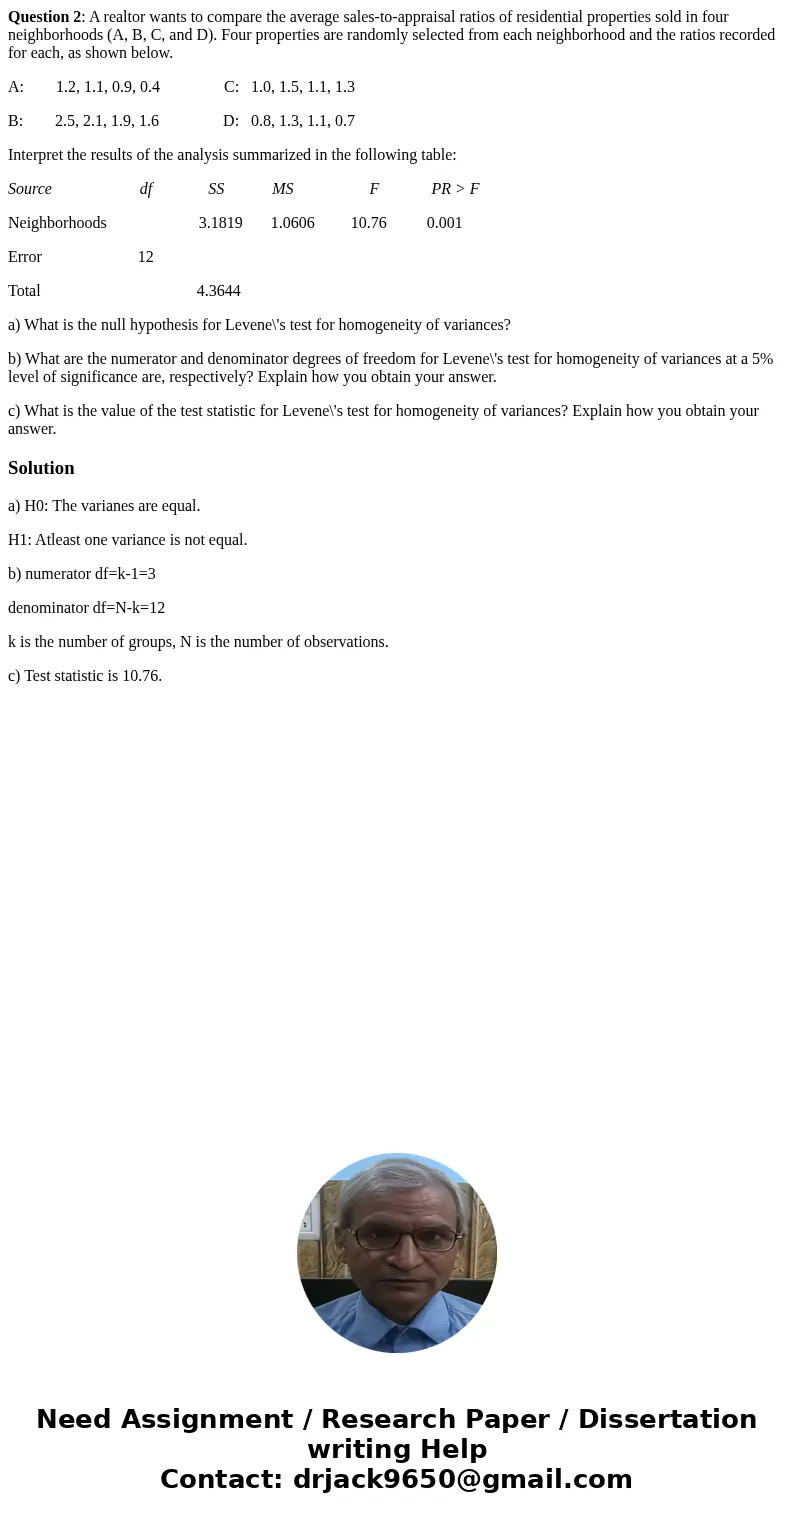
Question 2: A realtor wants to compare the average sales-to-appraisal ratios of residential properties sold in four neighborhoods (A, B, C, and D). Four properties are randomly selected from each neighborhood and the ratios recorded for each, as shown below.
A: 1.2, 1.1, 0.9, 0.4 C: 1.0, 1.5, 1.1, 1.3
B: 2.5, 2.1, 1.9, 1.6 D: 0.8, 1.3, 1.1, 0.7
Interpret the results of the analysis summarized in the following table:
Source df SS MS F PR > F
Neighborhoods 3.1819 1.0606 10.76 0.001
Error 12
Total 4.3644
a) What is the null hypothesis for Levene\'s test for homogeneity of variances?
b) What are the numerator and denominator degrees of freedom for Levene\'s test for homogeneity of variances at a 5% level of significance are, respectively? Explain how you obtain your answer.
c) What is the value of the test statistic for Levene\'s test for homogeneity of variances? Explain how you obtain your answer.
Solution
a) H0: The varianes are equal.
H1: Atleast one variance is not equal.
b) numerator df=k-1=3
denominator df=N-k=12
k is the number of groups, N is the number of observations.
c) Test statistic is 10.76.

 Homework Sourse