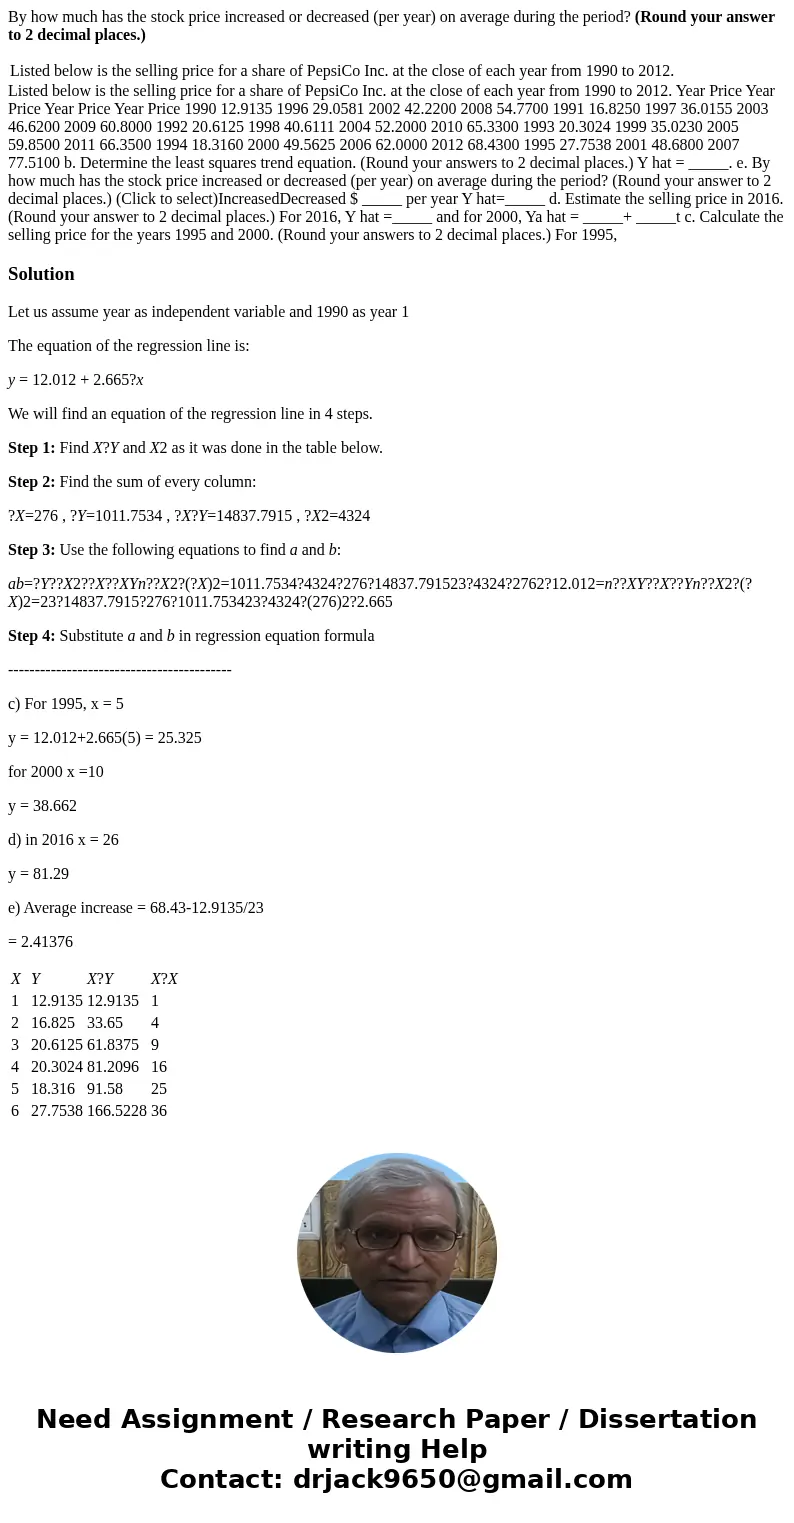
By how much has the stock price increased or decreased per y
By how much has the stock price increased or decreased (per year) on average during the period? (Round your answer to 2 decimal places.)
| Listed below is the selling price for a share of PepsiCo Inc. at the close of each year from 1990 to 2012. |
Solution
Let us assume year as independent variable and 1990 as year 1
The equation of the regression line is:
y = 12.012 + 2.665?x
We will find an equation of the regression line in 4 steps.
Step 1: Find X?Y and X2 as it was done in the table below.
Step 2: Find the sum of every column:
?X=276 , ?Y=1011.7534 , ?X?Y=14837.7915 , ?X2=4324
Step 3: Use the following equations to find a and b:
ab=?Y??X2??X??XYn??X2?(?X)2=1011.7534?4324?276?14837.791523?4324?2762?12.012=n??XY??X??Yn??X2?(?X)2=23?14837.7915?276?1011.753423?4324?(276)2?2.665
Step 4: Substitute a and b in regression equation formula
------------------------------------------
c) For 1995, x = 5
y = 12.012+2.665(5) = 25.325
for 2000 x =10
y = 38.662
d) in 2016 x = 26
y = 81.29
e) Average increase = 68.43-12.9135/23
= 2.41376
| X | Y | X?Y | X?X |
| 1 | 12.9135 | 12.9135 | 1 |
| 2 | 16.825 | 33.65 | 4 |
| 3 | 20.6125 | 61.8375 | 9 |
| 4 | 20.3024 | 81.2096 | 16 |
| 5 | 18.316 | 91.58 | 25 |
| 6 | 27.7538 | 166.5228 | 36 |
| 7 | 29.0581 | 203.4067 | 49 |
| 8 | 36.0155 | 288.124 | 64 |
| 9 | 40.6111 | 365.4999 | 81 |
| 10 | 35.023 | 350.23 | 100 |
| 11 | 49.5625 | 545.1875 | 121 |
| 12 | 48.68 | 584.16 | 144 |
| 13 | 42.22 | 548.86 | 169 |
| 14 | 46.62 | 652.68 | 196 |
| 15 | 52.2 | 783 | 225 |
| 16 | 59.85 | 957.6 | 256 |
| 17 | 62 | 1054 | 289 |
| 18 | 77.51 | 1395.18 | 324 |
| 19 | 54.77 | 1040.63 | 361 |
| 20 | 60.8 | 1216 | 400 |
| 21 | 65.33 | 1371.93 | 441 |
| 22 | 66.35 | 1459.7 | 484 |
| 23 | 68.43 | 1573.89 | 529 |

 Homework Sourse