MIU From the Bureau case Web page of Economic Analysis 1970
MIU From the Bureau case. Web page of Economic Analysis 1970, real for 1980, 1990, 2000, and 2010. Show the percentage change in real GDP over each of those decades. Do the percentages of GDP spent on consumption (C, investment (I), government (G), exports (X) and imports (M) differ significantly among those years? Are there changes in the balance of trade over the period? Explain. 3 From the Bureau of Economic Analysis Web page (www.bea.gov), construct a table showing the annual percentage change in real GDP gross pri- vate domestic investment (D, nonresidential fixed investment, and residential fixed investment from 2002 to 2011. Which component of investment had the greatest impact on the recession of 2007 to 2009? 4. Find an article in a current business publication that a the Dp data How sig

Solution
(2) (Data values in $ billion (2009 chained))
As we notice,
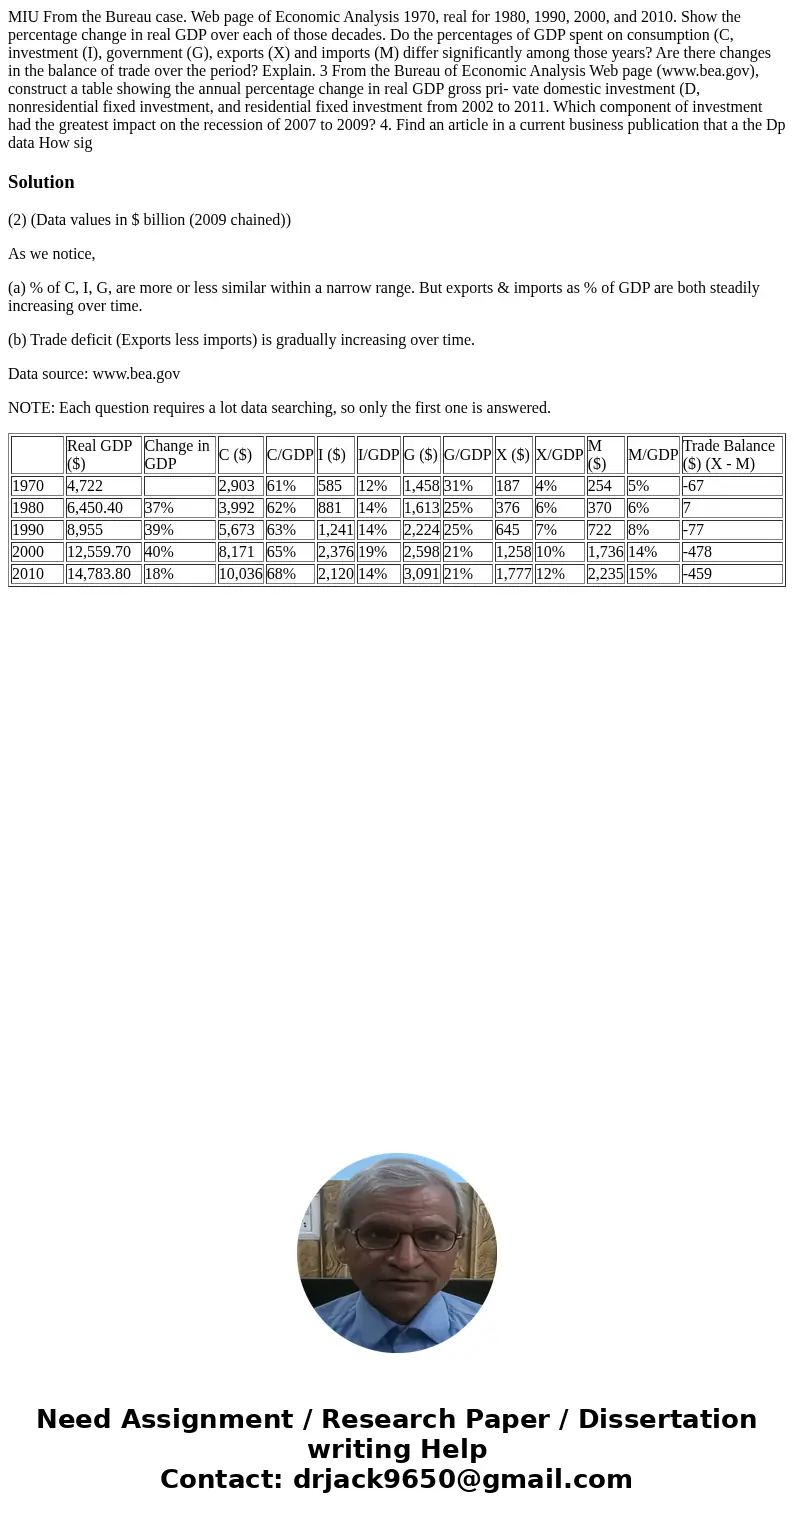
(a) % of C, I, G, are more or less similar within a narrow range. But exports & imports as % of GDP are both steadily increasing over time.
(b) Trade deficit (Exports less imports) is gradually increasing over time.
Data source: www.bea.gov
NOTE: Each question requires a lot data searching, so only the first one is answered.
| Real GDP ($) | Change in GDP | C ($) | C/GDP | I ($) | I/GDP | G ($) | G/GDP | X ($) | X/GDP | M ($) | M/GDP | Trade Balance ($) (X - M) | |
| 1970 | 4,722 | 2,903 | 61% | 585 | 12% | 1,458 | 31% | 187 | 4% | 254 | 5% | -67 | |
| 1980 | 6,450.40 | 37% | 3,992 | 62% | 881 | 14% | 1,613 | 25% | 376 | 6% | 370 | 6% | 7 |
| 1990 | 8,955 | 39% | 5,673 | 63% | 1,241 | 14% | 2,224 | 25% | 645 | 7% | 722 | 8% | -77 |
| 2000 | 12,559.70 | 40% | 8,171 | 65% | 2,376 | 19% | 2,598 | 21% | 1,258 | 10% | 1,736 | 14% | -478 |
| 2010 | 14,783.80 | 18% | 10,036 | 68% | 2,120 | 14% | 3,091 | 21% | 1,777 | 12% | 2,235 | 15% | -459 |

 Homework Sourse