The frequency distribution to the right shows the number of
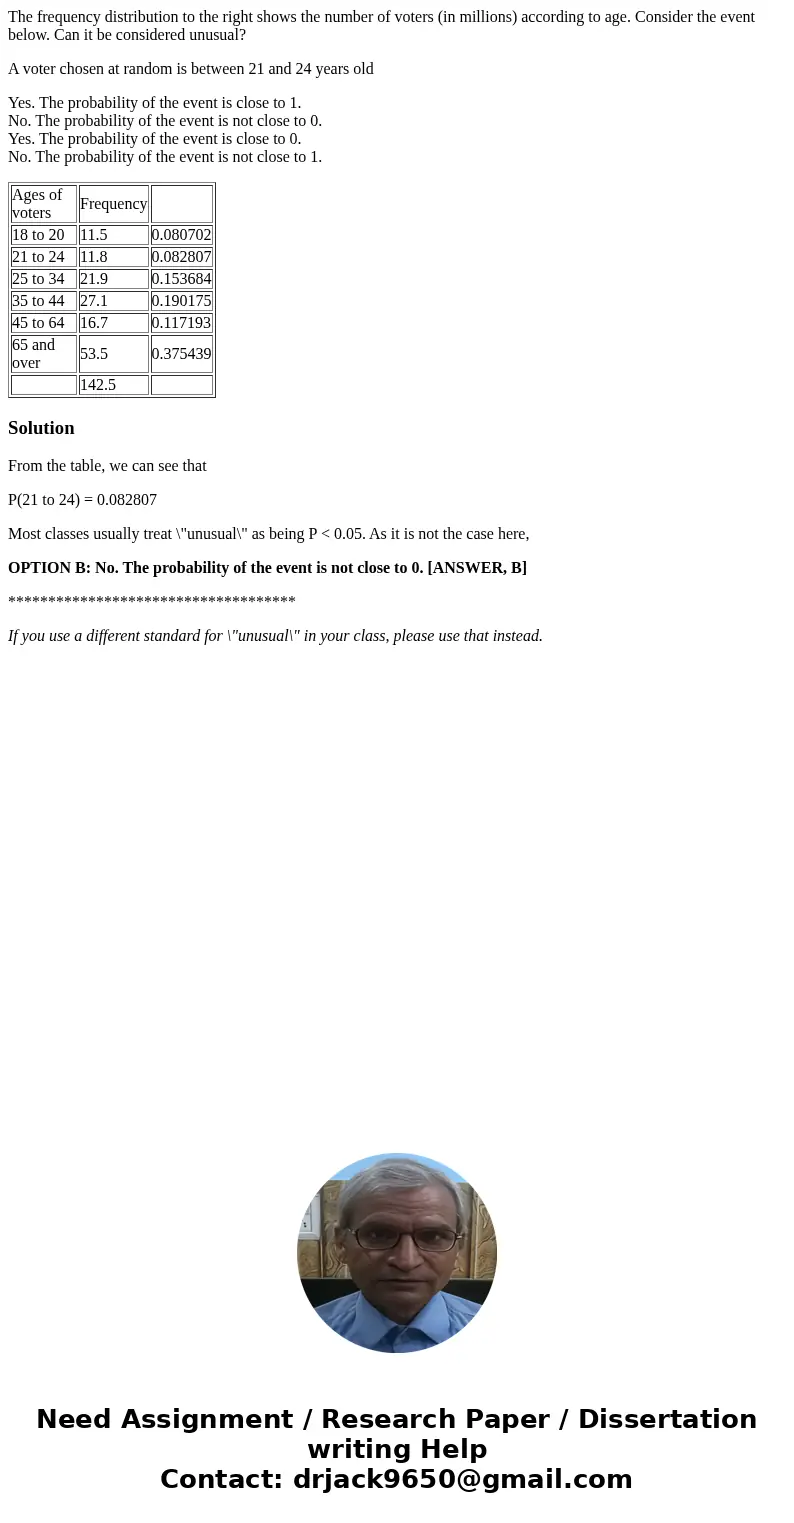
The frequency distribution to the right shows the number of voters (in millions) according to age. Consider the event below. Can it be considered unusual?
A voter chosen at random is between 21 and 24 years old
Yes. The probability of the event is close to 1.
No. The probability of the event is not close to 0.
Yes. The probability of the event is close to 0.
No. The probability of the event is not close to 1.
| Ages of voters | Frequency | |
| 18 to 20 | 11.5 | 0.080702 |
| 21 to 24 | 11.8 | 0.082807 |
| 25 to 34 | 21.9 | 0.153684 |
| 35 to 44 | 27.1 | 0.190175 |
| 45 to 64 | 16.7 | 0.117193 |
| 65 and over | 53.5 | 0.375439 |
| 142.5 |
Solution
From the table, we can see that
P(21 to 24) = 0.082807
Most classes usually treat \"unusual\" as being P < 0.05. As it is not the case here,
OPTION B: No. The probability of the event is not close to 0. [ANSWER, B]
************************************
If you use a different standard for \"unusual\" in your class, please use that instead.

 Homework Sourse