The following table shows the cost data and demand schedule
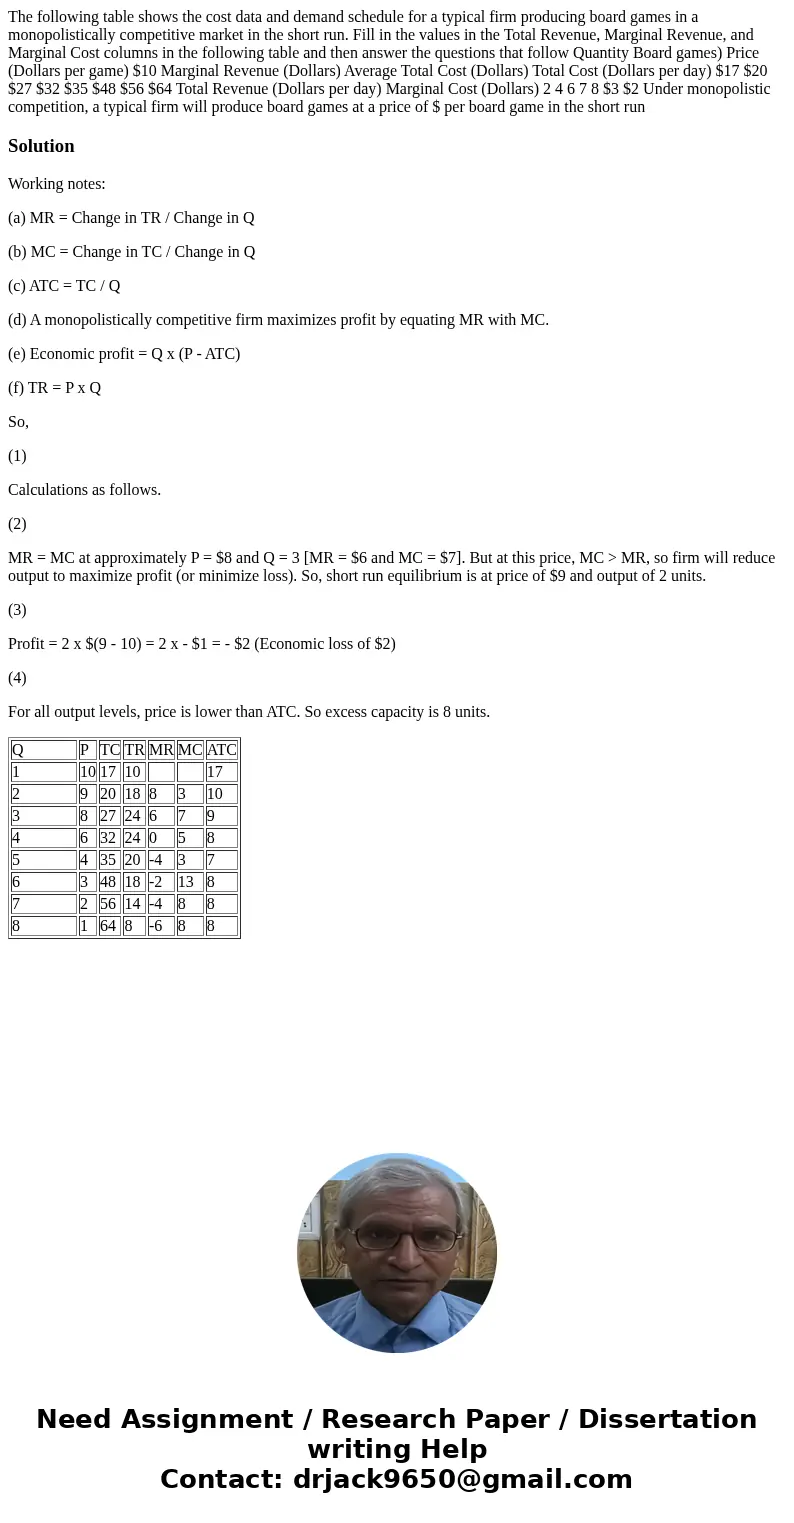
The following table shows the cost data and demand schedule for a typical firm producing board games in a monopolistically competitive market in the short run. Fill in the values in the Total Revenue, Marginal Revenue, and Marginal Cost columns in the following table and then answer the questions that follow Quantity Board games) Price (Dollars per game) $10 Marginal Revenue (Dollars) Average Total Cost (Dollars) Total Cost (Dollars per day) $17 $20 $27 $32 $35 $48 $56 $64 Total Revenue (Dollars per day) Marginal Cost (Dollars) 2 4 6 7 8 $3 $2 Under monopolistic competition, a typical firm will produce board games at a price of $ per board game in the short run

Solution
Working notes:
(a) MR = Change in TR / Change in Q
(b) MC = Change in TC / Change in Q
(c) ATC = TC / Q
(d) A monopolistically competitive firm maximizes profit by equating MR with MC.
(e) Economic profit = Q x (P - ATC)
(f) TR = P x Q
So,
(1)
Calculations as follows.
(2)
MR = MC at approximately P = $8 and Q = 3 [MR = $6 and MC = $7]. But at this price, MC > MR, so firm will reduce output to maximize profit (or minimize loss). So, short run equilibrium is at price of $9 and output of 2 units.
(3)
Profit = 2 x $(9 - 10) = 2 x - $1 = - $2 (Economic loss of $2)
(4)
For all output levels, price is lower than ATC. So excess capacity is 8 units.
| Q | P | TC | TR | MR | MC | ATC |
| 1 | 10 | 17 | 10 | 17 | ||
| 2 | 9 | 20 | 18 | 8 | 3 | 10 |
| 3 | 8 | 27 | 24 | 6 | 7 | 9 |
| 4 | 6 | 32 | 24 | 0 | 5 | 8 |
| 5 | 4 | 35 | 20 | -4 | 3 | 7 |
| 6 | 3 | 48 | 18 | -2 | 13 | 8 |
| 7 | 2 | 56 | 14 | -4 | 8 | 8 |
| 8 | 1 | 64 | 8 | -6 | 8 | 8 |

 Homework Sourse