Data were gathered from 558 female Mexican Americans ages 14
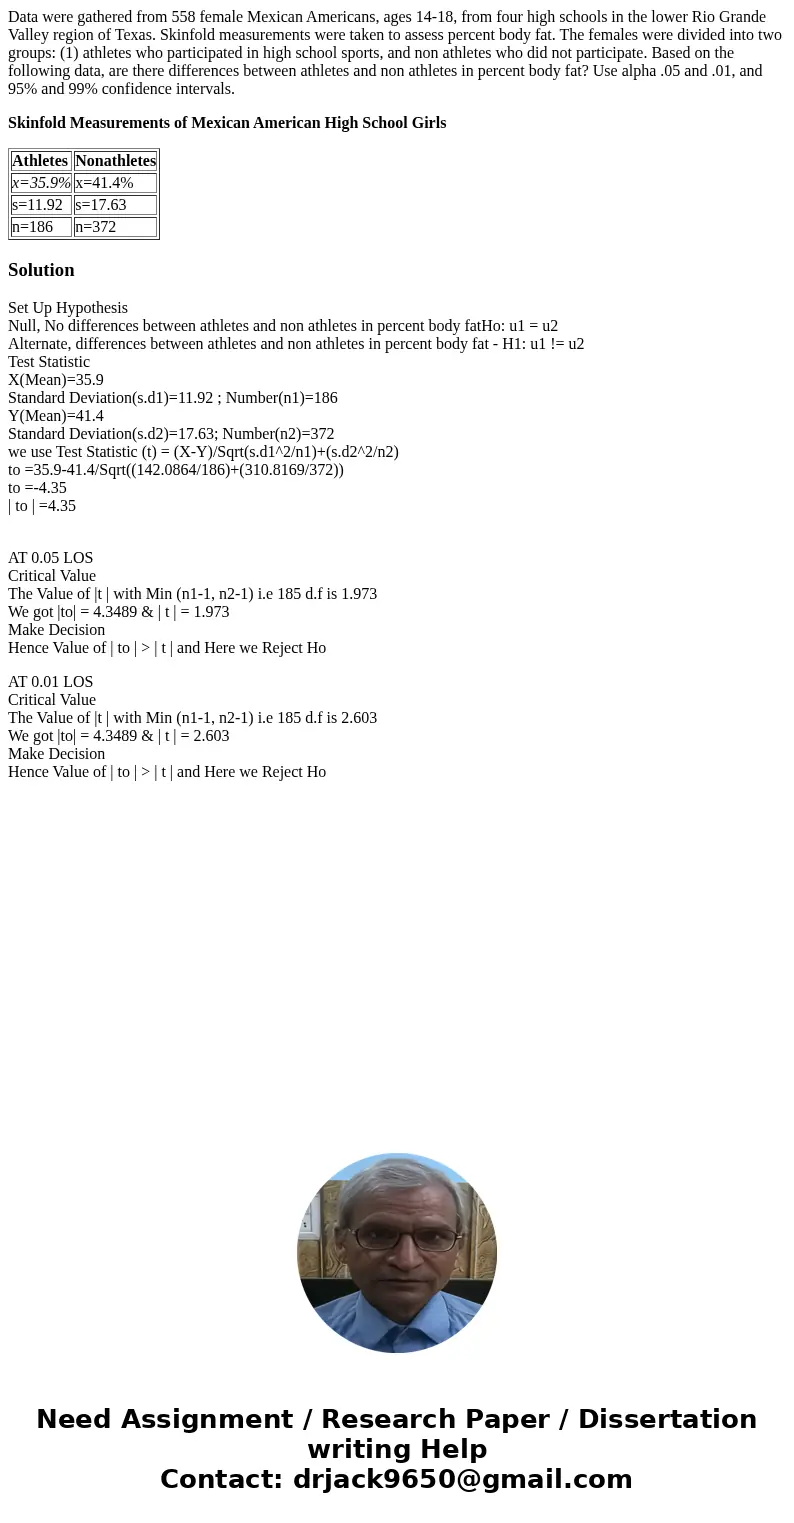
Data were gathered from 558 female Mexican Americans, ages 14-18, from four high schools in the lower Rio Grande Valley region of Texas. Skinfold measurements were taken to assess percent body fat. The females were divided into two groups: (1) athletes who participated in high school sports, and non athletes who did not participate. Based on the following data, are there differences between athletes and non athletes in percent body fat? Use alpha .05 and .01, and 95% and 99% confidence intervals.
Skinfold Measurements of Mexican American High School Girls
| Athletes | Nonathletes |
| x=35.9% | x=41.4% |
| s=11.92 | s=17.63 |
| n=186 | n=372 |
Solution
Set Up Hypothesis
Null, No differences between athletes and non athletes in percent body fatHo: u1 = u2
Alternate, differences between athletes and non athletes in percent body fat - H1: u1 != u2
Test Statistic
X(Mean)=35.9
Standard Deviation(s.d1)=11.92 ; Number(n1)=186
Y(Mean)=41.4
Standard Deviation(s.d2)=17.63; Number(n2)=372
we use Test Statistic (t) = (X-Y)/Sqrt(s.d1^2/n1)+(s.d2^2/n2)
to =35.9-41.4/Sqrt((142.0864/186)+(310.8169/372))
to =-4.35
| to | =4.35
AT 0.05 LOS
Critical Value
The Value of |t | with Min (n1-1, n2-1) i.e 185 d.f is 1.973
We got |to| = 4.3489 & | t | = 1.973
Make Decision
Hence Value of | to | > | t | and Here we Reject Ho
AT 0.01 LOS
Critical Value
The Value of |t | with Min (n1-1, n2-1) i.e 185 d.f is 2.603
We got |to| = 4.3489 & | t | = 2.603
Make Decision
Hence Value of | to | > | t | and Here we Reject Ho

 Homework Sourse