7 please show any relevant steps Thanks iPad 317 PM Quizzes
(7) please show any relevant steps. Thanks!
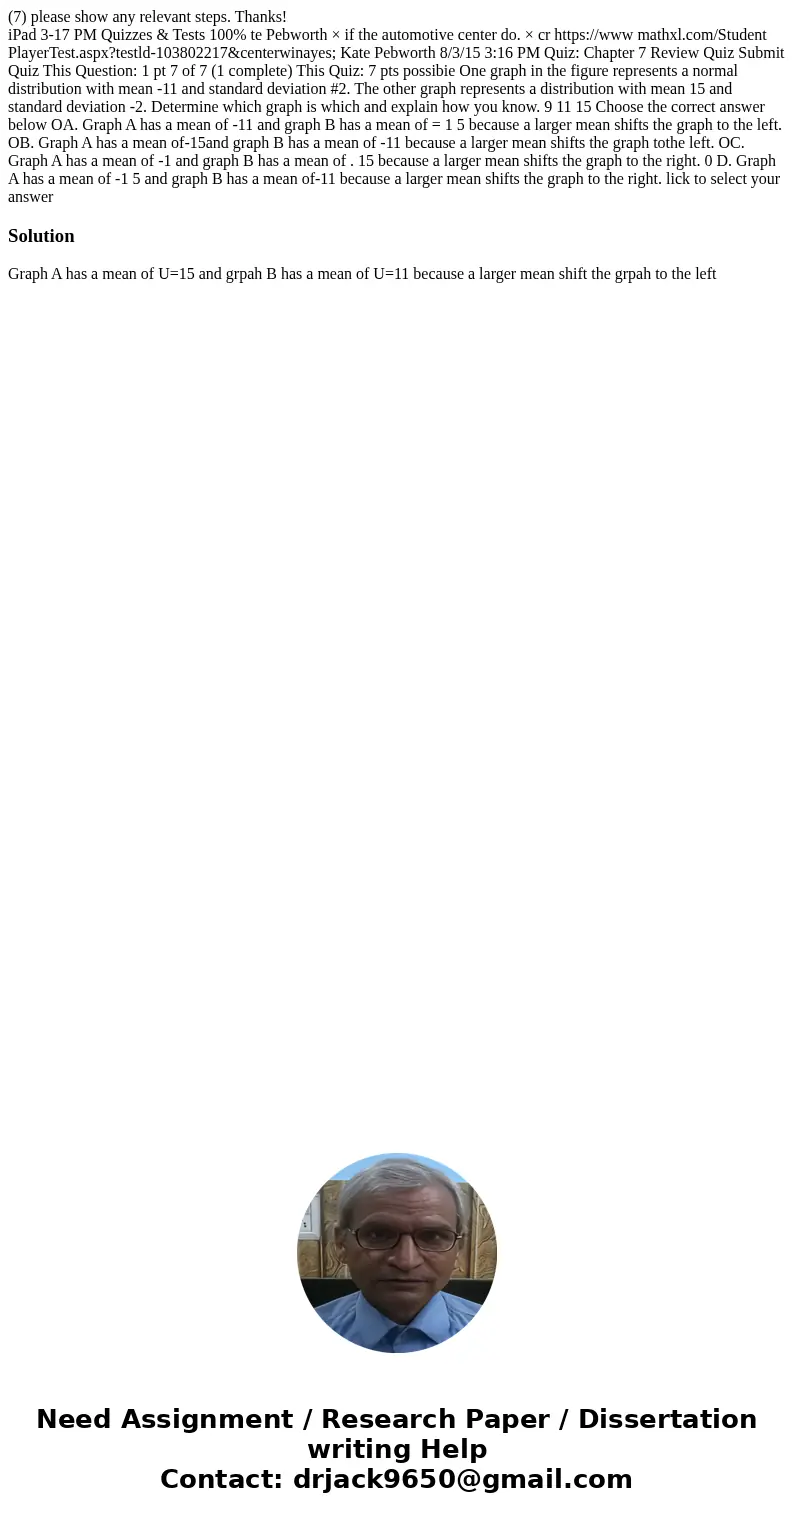
iPad 3-17 PM Quizzes & Tests 100% te Pebworth × if the automotive center do. × cr https://www mathxl.com/Student PlayerTest.aspx?testld-103802217¢erwinayes; Kate Pebworth 8/3/15 3:16 PM Quiz: Chapter 7 Review Quiz Submit Quiz This Question: 1 pt 7 of 7 (1 complete) This Quiz: 7 pts possibie One graph in the figure represents a normal distribution with mean -11 and standard deviation #2. The other graph represents a distribution with mean 15 and standard deviation -2. Determine which graph is which and explain how you know. 9 11 15 Choose the correct answer below OA. Graph A has a mean of -11 and graph B has a mean of = 1 5 because a larger mean shifts the graph to the left. OB. Graph A has a mean of-15and graph B has a mean of -11 because a larger mean shifts the graph tothe left. OC. Graph A has a mean of -1 and graph B has a mean of . 15 because a larger mean shifts the graph to the right. 0 D. Graph A has a mean of -1 5 and graph B has a mean of-11 because a larger mean shifts the graph to the right. lick to select your answer Solution
Graph A has a mean of U=15 and grpah B has a mean of U=11 because a larger mean shift the grpah to the left

 Homework Sourse