In ongoing economic analyses the US federal government compa
In ongoing economic analyses, the U.S. federal government compares per capita incomes not only among different states but also for the same state at different times. Typically, what the federal government finds is that \"poor\" states tend to stay poor and \"wealthy\" states tend to stay wealthy.
1980 per capital income, X ( in $1000s)
Choose one
greater than
less than
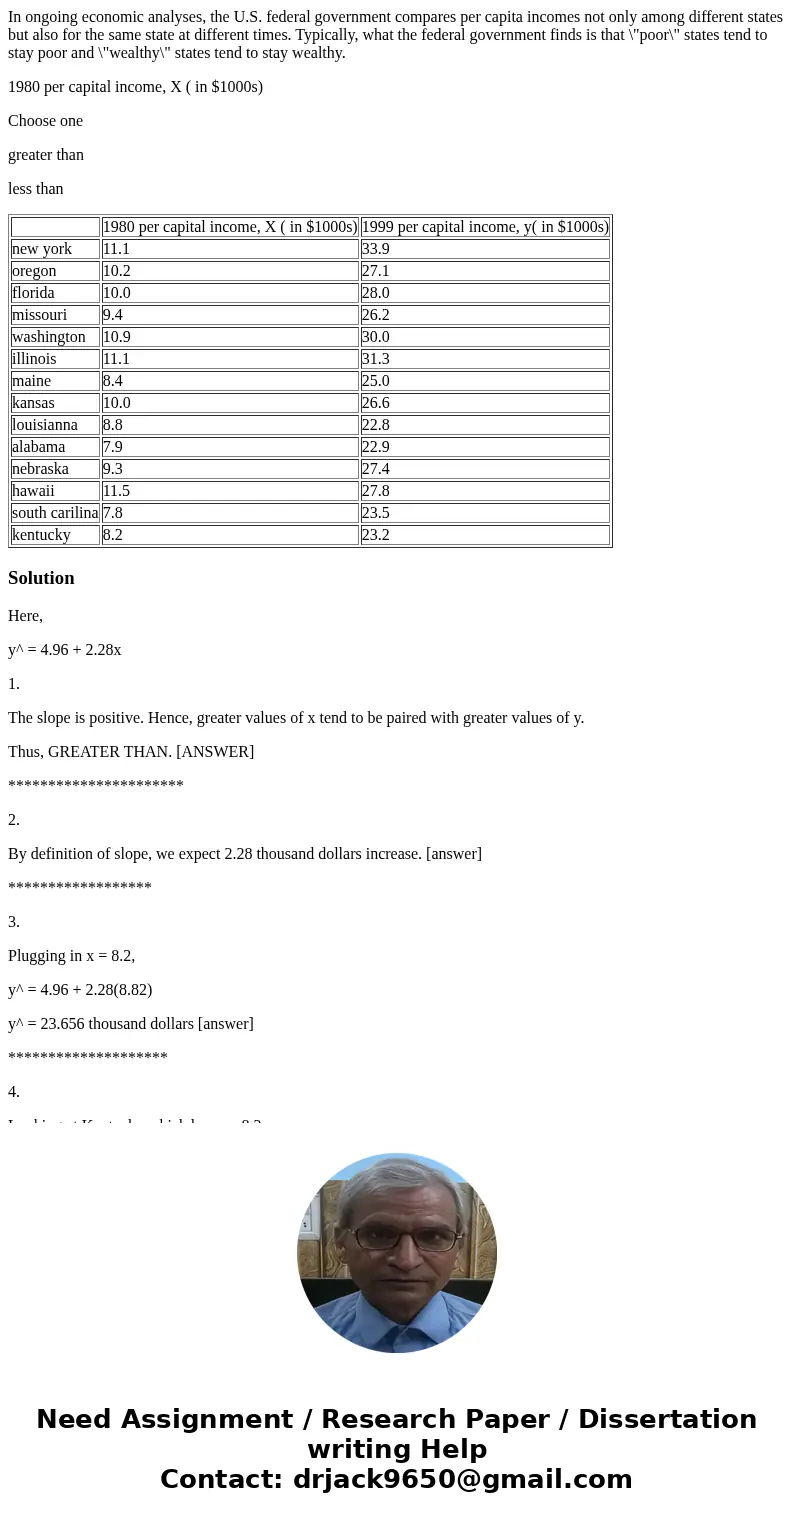
| 1980 per capital income, X ( in $1000s) | 1999 per capital income, y( in $1000s) | |
| new york | 11.1 | 33.9 |
| oregon | 10.2 | 27.1 |
| florida | 10.0 | 28.0 |
| missouri | 9.4 | 26.2 |
| washington | 10.9 | 30.0 |
| illinois | 11.1 | 31.3 |
| maine | 8.4 | 25.0 |
| kansas | 10.0 | 26.6 |
| louisianna | 8.8 | 22.8 |
| alabama | 7.9 | 22.9 |
| nebraska | 9.3 | 27.4 |
| hawaii | 11.5 | 27.8 |
| south carilina | 7.8 | 23.5 |
| kentucky | 8.2 | 23.2 |
Solution
Here,
y^ = 4.96 + 2.28x
1.
The slope is positive. Hence, greater values of x tend to be paired with greater values of y.
Thus, GREATER THAN. [ANSWER]
**********************
2.
By definition of slope, we expect 2.28 thousand dollars increase. [answer]
******************
3.
Plugging in x = 8.2,
y^ = 4.96 + 2.28(8.82)
y^ = 23.656 thousand dollars [answer]
********************
4.
Looking at Kentucky which has x = 8.2,
y(observed) = 23.2 thousand dollars [answer]

 Homework Sourse