The deflection temperature under load for two different type
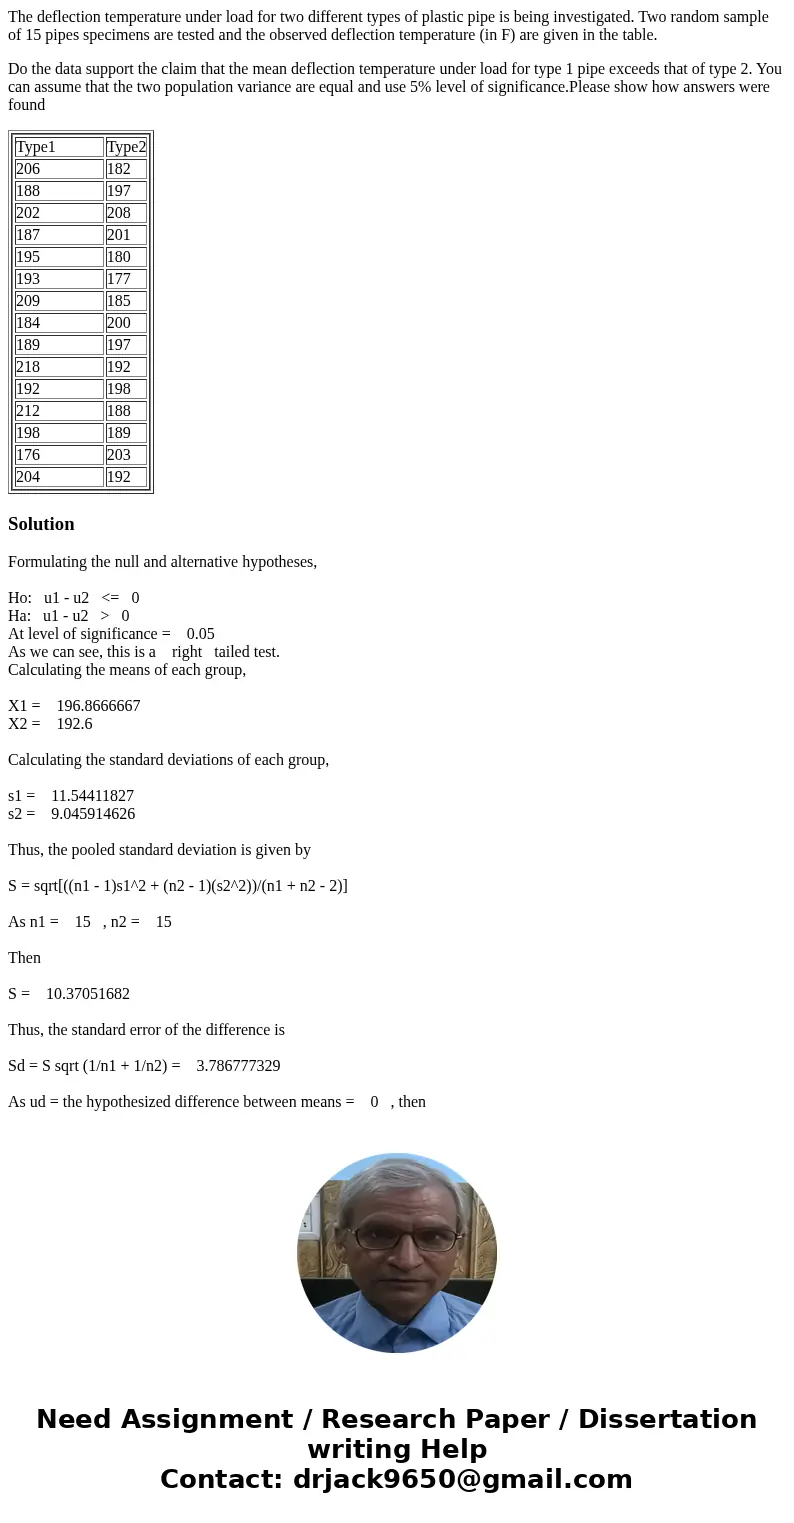
The deflection temperature under load for two different types of plastic pipe is being investigated. Two random sample of 15 pipes specimens are tested and the observed deflection temperature (in F) are given in the table.
Do the data support the claim that the mean deflection temperature under load for type 1 pipe exceeds that of type 2. You can assume that the two population variance are equal and use 5% level of significance.Please show how answers were found
|
Solution
Formulating the null and alternative hypotheses,
Ho: u1 - u2 <= 0
Ha: u1 - u2 > 0
At level of significance = 0.05
As we can see, this is a right tailed test.
Calculating the means of each group,
X1 = 196.8666667
X2 = 192.6
Calculating the standard deviations of each group,
s1 = 11.54411827
s2 = 9.045914626
Thus, the pooled standard deviation is given by
S = sqrt[((n1 - 1)s1^2 + (n2 - 1)(s2^2))/(n1 + n2 - 2)]
As n1 = 15 , n2 = 15
Then
S = 10.37051682
Thus, the standard error of the difference is
Sd = S sqrt (1/n1 + 1/n2) = 3.786777329
As ud = the hypothesized difference between means = 0 , then
t = [X1 - X2 - ud]/Sd = 1.126727636
Getting the critical value using table/technology,
df = n1 + n2 - 2 = 28
tcrit = + 1.701130934
As t < 1.7011, we FAIL TO REJECT THE NULL HYPOTHESIS.
Thus, there is no significant evidence at 0.05 level that the mean deflection temperature under load for type 1 pipe exceeds that of type 2. [CONCLUSION]
*****************************************************
Hi! If you use another method/formula in calculating the degrees of freedom in this two tailed test, please resubmit this question together with the formula/method you use in determining the degrees of freedom. That way we can continue helping you! Thanks!


 Homework Sourse