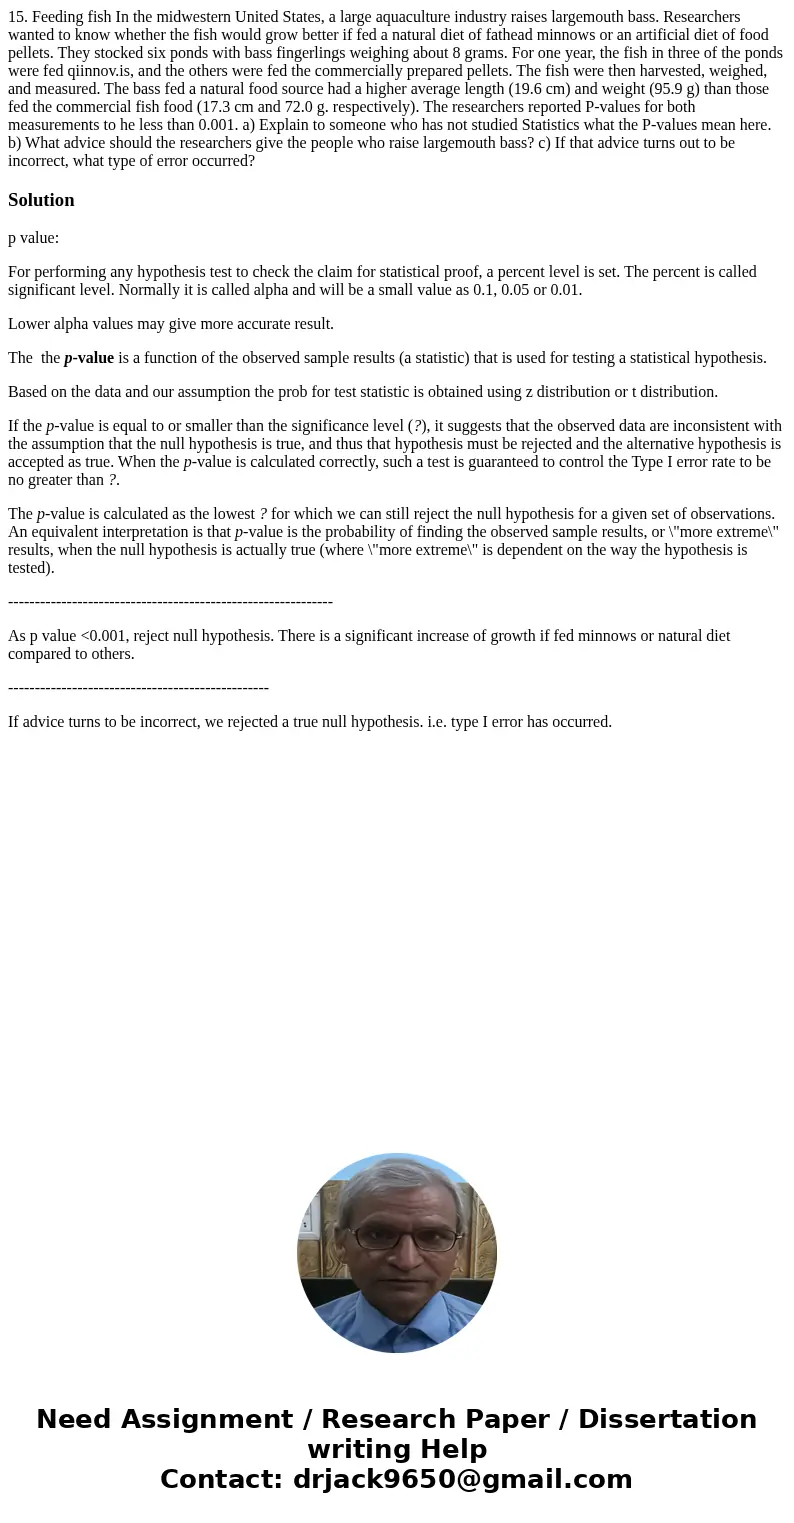
15 Feeding fish In the midwestern United States a large aqua
Solution
p value:
For performing any hypothesis test to check the claim for statistical proof, a percent level is set. The percent is called significant level. Normally it is called alpha and will be a small value as 0.1, 0.05 or 0.01.
Lower alpha values may give more accurate result.
The the p-value is a function of the observed sample results (a statistic) that is used for testing a statistical hypothesis.
Based on the data and our assumption the prob for test statistic is obtained using z distribution or t distribution.
If the p-value is equal to or smaller than the significance level (?), it suggests that the observed data are inconsistent with the assumption that the null hypothesis is true, and thus that hypothesis must be rejected and the alternative hypothesis is accepted as true. When the p-value is calculated correctly, such a test is guaranteed to control the Type I error rate to be no greater than ?.
The p-value is calculated as the lowest ? for which we can still reject the null hypothesis for a given set of observations. An equivalent interpretation is that p-value is the probability of finding the observed sample results, or \"more extreme\" results, when the null hypothesis is actually true (where \"more extreme\" is dependent on the way the hypothesis is tested).
-------------------------------------------------------------
As p value <0.001, reject null hypothesis. There is a significant increase of growth if fed minnows or natural diet compared to others.
-------------------------------------------------
If advice turns to be incorrect, we rejected a true null hypothesis. i.e. type I error has occurred.

 Homework Sourse