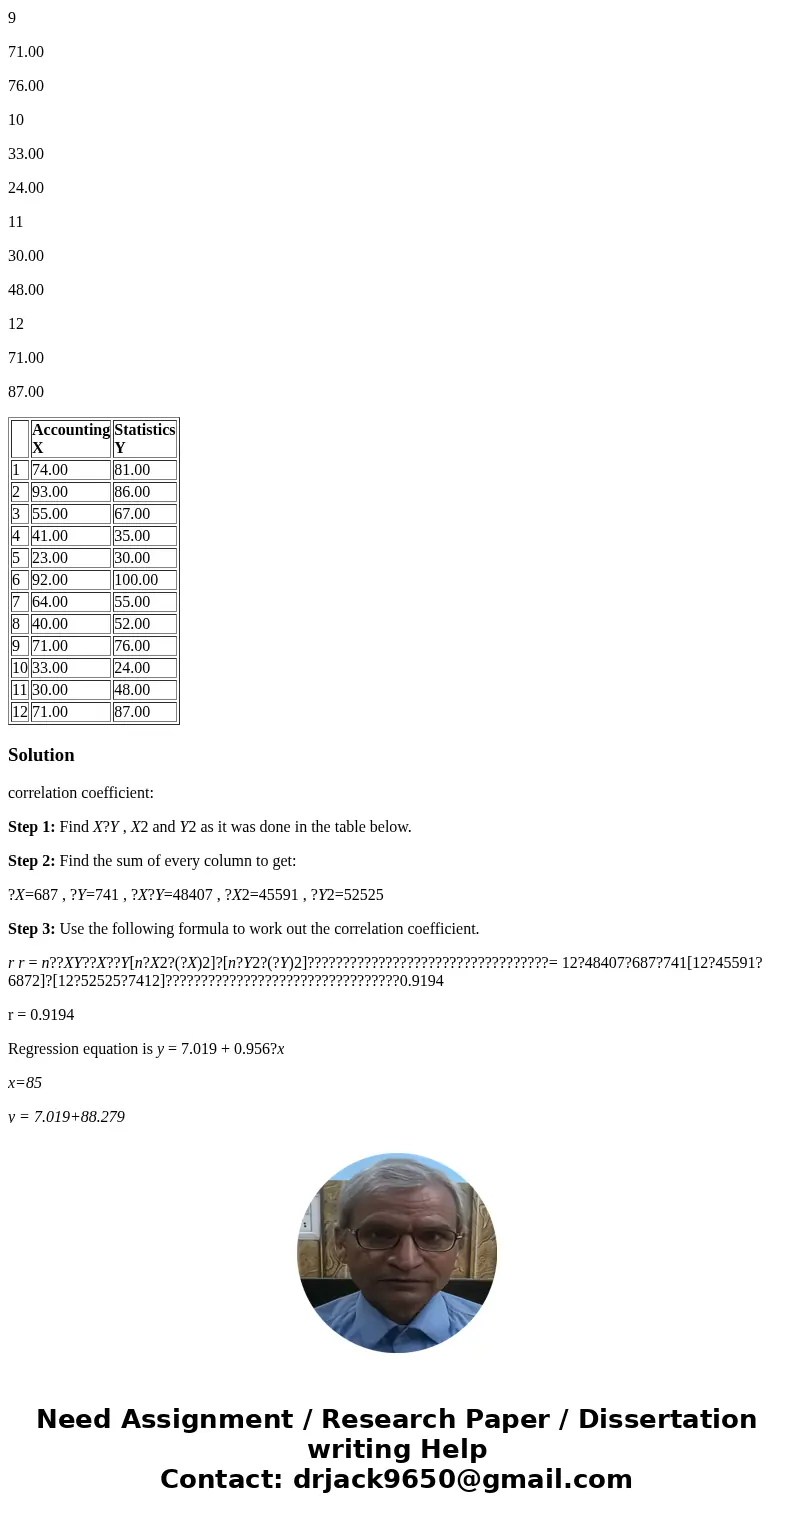
The following data shows the score of 12 students for Accoun
The following data shows the score of 12 students for Accounting and Statistics
examinations.
a)Calculate a simple correlation coefficient
b)Fit a regression equation of Statistics on Accounting using least square estimates.
c)Predict the score of Statistics if the score of accounting is 85.
Accounting
X
Statistics
Y
1
74.00
81.00
2
93.00
86.00
3
55.00
67.00
4
41.00
35.00
5
23.00
30.00
6
92.00
100.00
7
64.00
55.00
8
40.00
52.00
9
71.00
76.00
10
33.00
24.00
11
30.00
48.00
12
71.00
87.00
| Accounting | Statistics | |
| 1 | 74.00 | 81.00 |
| 2 | 93.00 | 86.00 |
| 3 | 55.00 | 67.00 |
| 4 | 41.00 | 35.00 |
| 5 | 23.00 | 30.00 |
| 6 | 92.00 | 100.00 |
| 7 | 64.00 | 55.00 |
| 8 | 40.00 | 52.00 |
| 9 | 71.00 | 76.00 |
| 10 | 33.00 | 24.00 |
| 11 | 30.00 | 48.00 |
| 12 | 71.00 | 87.00 |
Solution
correlation coefficient:
Step 1: Find X?Y , X2 and Y2 as it was done in the table below.
Step 2: Find the sum of every column to get:
?X=687 , ?Y=741 , ?X?Y=48407 , ?X2=45591 , ?Y2=52525
Step 3: Use the following formula to work out the correlation coefficient.
r r = n??XY??X??Y[n?X2?(?X)2]?[n?Y2?(?Y)2]??????????????????????????????????= 12?48407?687?741[12?45591?6872]?[12?52525?7412]?????????????????????????????????0.9194
r = 0.9194
Regression equation is y = 7.019 + 0.956?x
x=85
y = 7.019+88.279
| X | Y | X?Y | X?X | Y?Y |
| 74 | 81 | 5994 | 5476 | 6561 |
| 93 | 86 | 7998 | 8649 | 7396 |
| 55 | 67 | 3685 | 3025 | 4489 |
| 41 | 35 | 1435 | 1681 | 1225 |
| 23 | 30 | 690 | 529 | 900 |
| 92 | 100 | 9200 | 8464 | 10000 |
| 64 | 55 | 3520 | 4096 | 3025 |
| 40 | 52 | 2080 | 1600 | 2704 |
| 71 | 76 | 5396 | 5041 | 5776 |
| 33 | 24 | 792 | 1089 | 576 |
| 30 | 48 | 1440 | 900 | 2304 |
| 71 | 87 | 6177 | 5041 | 7569 |


 Homework Sourse