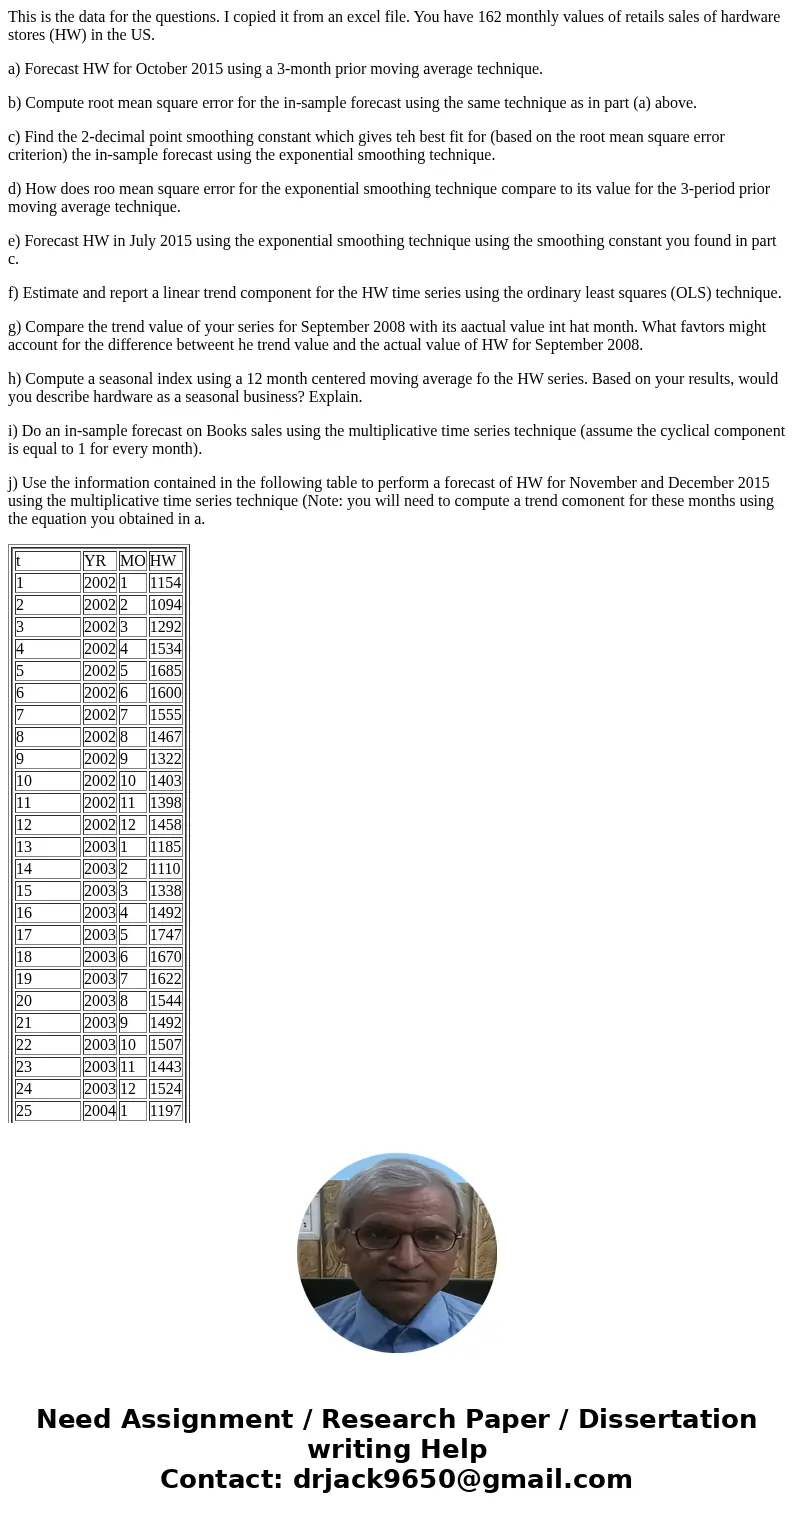
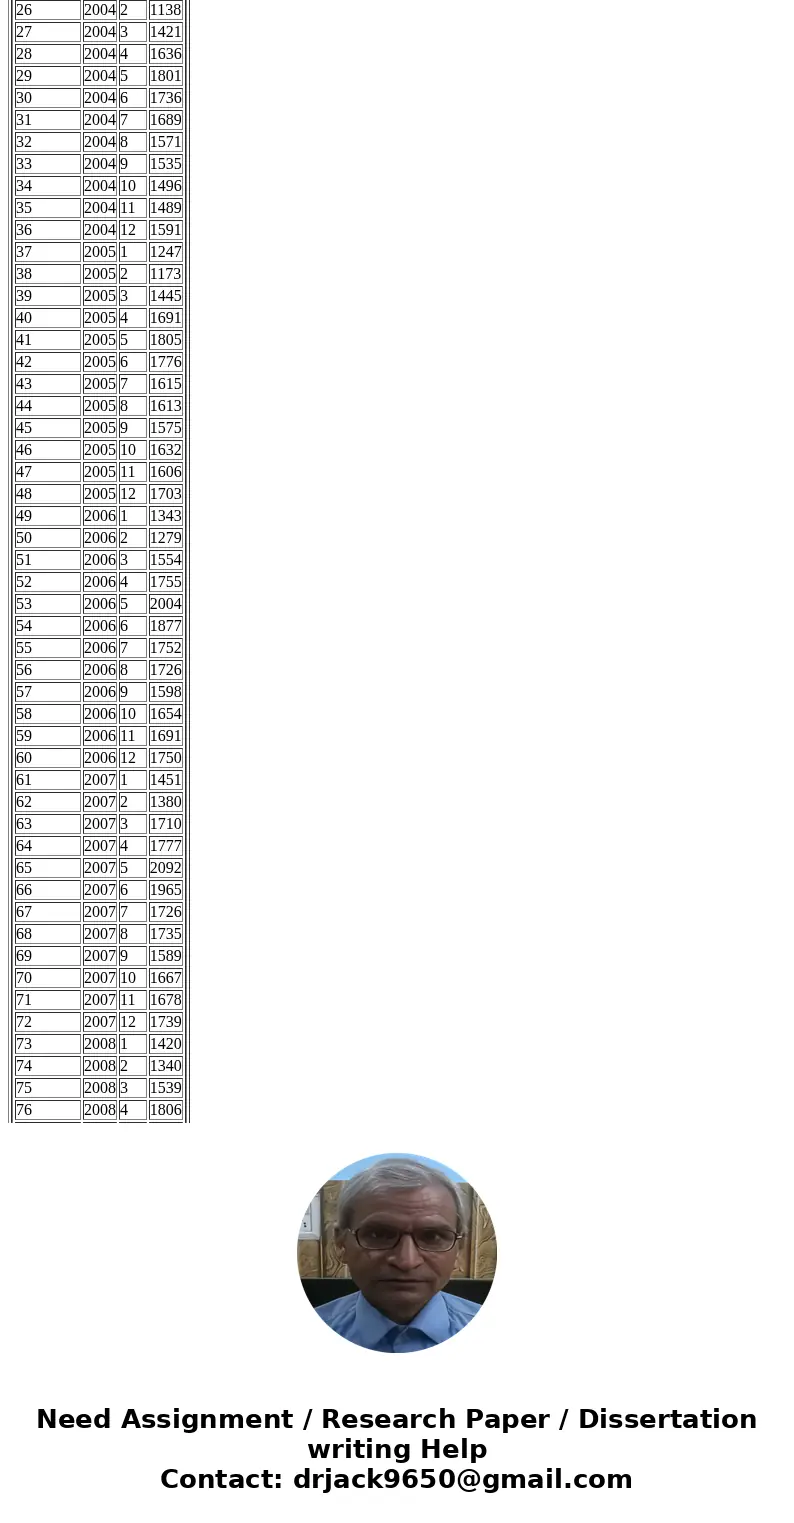
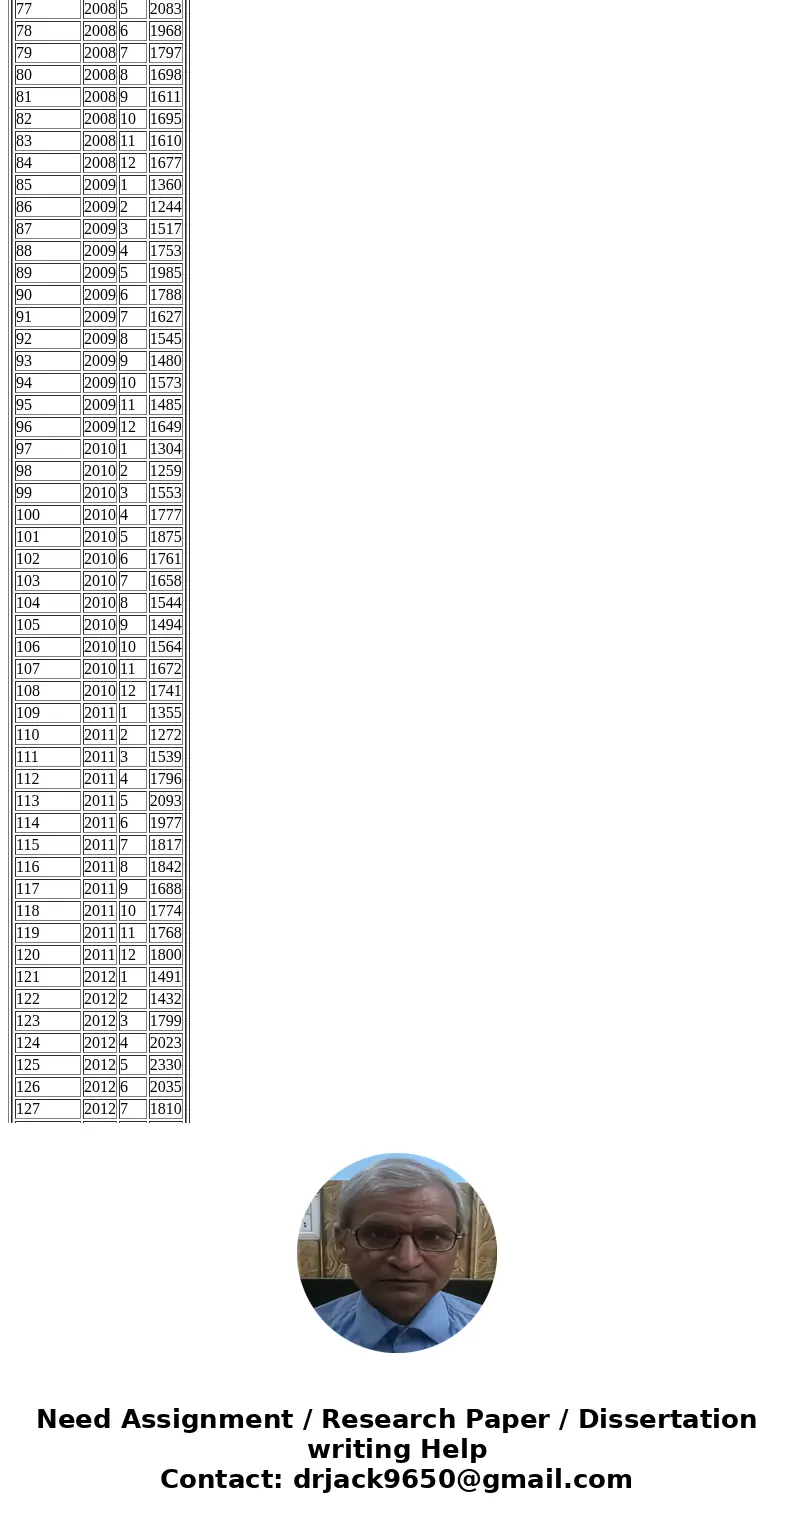
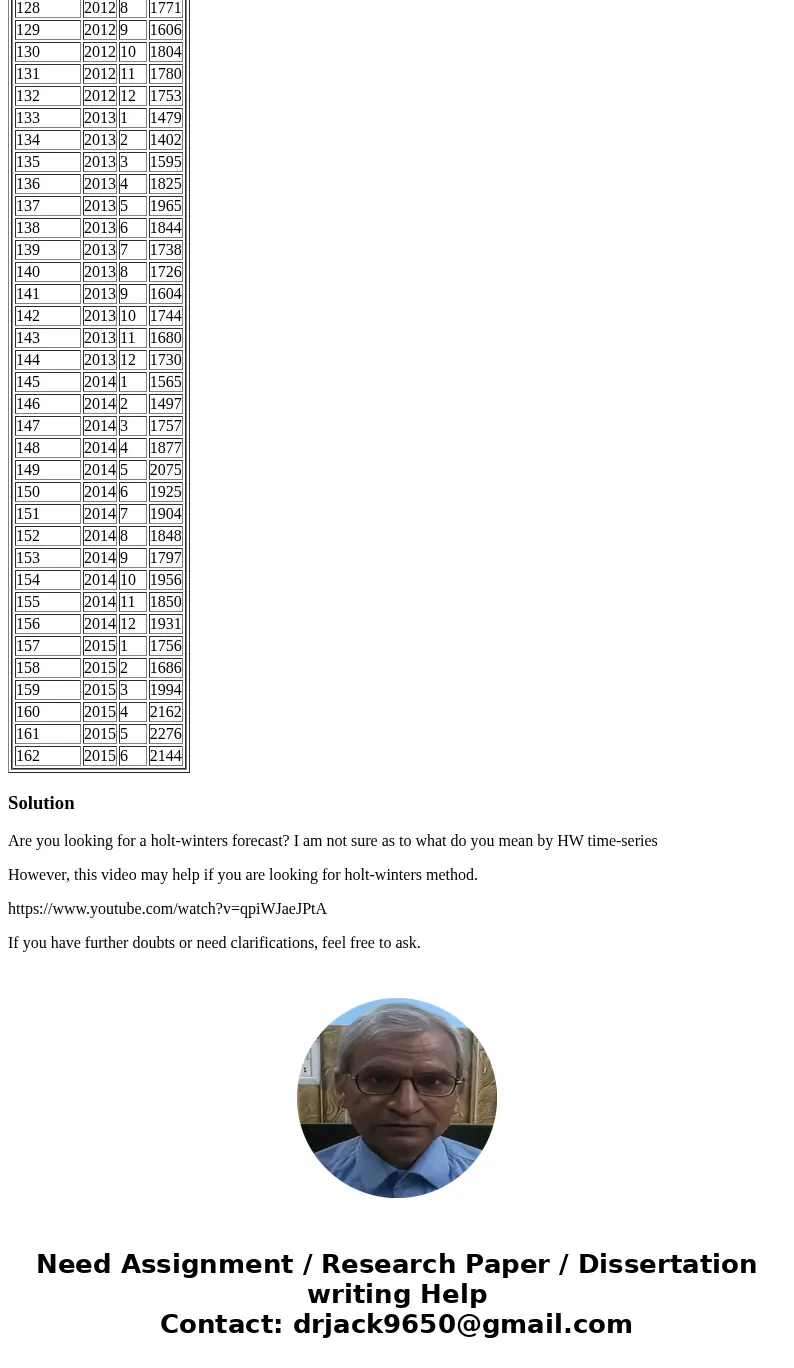
This is the data for the questions. I copied it from an excel file. You have 162 monthly values of retails sales of hardware stores (HW) in the US.
a) Forecast HW for October 2015 using a 3-month prior moving average technique.
b) Compute root mean square error for the in-sample forecast using the same technique as in part (a) above.
c) Find the 2-decimal point smoothing constant which gives teh best fit for (based on the root mean square error criterion) the in-sample forecast using the exponential smoothing technique.
d) How does roo mean square error for the exponential smoothing technique compare to its value for the 3-period prior moving average technique.
e) Forecast HW in July 2015 using the exponential smoothing technique using the smoothing constant you found in part c.
f) Estimate and report a linear trend component for the HW time series using the ordinary least squares (OLS) technique.
g) Compare the trend value of your series for September 2008 with its aactual value int hat month. What favtors might account for the difference betweent he trend value and the actual value of HW for September 2008.
h) Compute a seasonal index using a 12 month centered moving average fo the HW series. Based on your results, would you describe hardware as a seasonal business? Explain.
i) Do an in-sample forecast on Books sales using the multiplicative time series technique (assume the cyclical component is equal to 1 for every month).
j) Use the information contained in the following table to perform a forecast of HW for November and December 2015 using the multiplicative time series technique (Note: you will need to compute a trend comonent for these months using the equation you obtained in a.
| t | YR | MO | HW | | 1 | 2002 | 1 | 1154 | | 2 | 2002 | 2 | 1094 | | 3 | 2002 | 3 | 1292 | | 4 | 2002 | 4 | 1534 | | 5 | 2002 | 5 | 1685 | | 6 | 2002 | 6 | 1600 | | 7 | 2002 | 7 | 1555 | | 8 | 2002 | 8 | 1467 | | 9 | 2002 | 9 | 1322 | | 10 | 2002 | 10 | 1403 | | 11 | 2002 | 11 | 1398 | | 12 | 2002 | 12 | 1458 | | 13 | 2003 | 1 | 1185 | | 14 | 2003 | 2 | 1110 | | 15 | 2003 | 3 | 1338 | | 16 | 2003 | 4 | 1492 | | 17 | 2003 | 5 | 1747 | | 18 | 2003 | 6 | 1670 | | 19 | 2003 | 7 | 1622 | | 20 | 2003 | 8 | 1544 | | 21 | 2003 | 9 | 1492 | | 22 | 2003 | 10 | 1507 | | 23 | 2003 | 11 | 1443 | | 24 | 2003 | 12 | 1524 | | 25 | 2004 | 1 | 1197 | | 26 | 2004 | 2 | 1138 | | 27 | 2004 | 3 | 1421 | | 28 | 2004 | 4 | 1636 | | 29 | 2004 | 5 | 1801 | | 30 | 2004 | 6 | 1736 | | 31 | 2004 | 7 | 1689 | | 32 | 2004 | 8 | 1571 | | 33 | 2004 | 9 | 1535 | | 34 | 2004 | 10 | 1496 | | 35 | 2004 | 11 | 1489 | | 36 | 2004 | 12 | 1591 | | 37 | 2005 | 1 | 1247 | | 38 | 2005 | 2 | 1173 | | 39 | 2005 | 3 | 1445 | | 40 | 2005 | 4 | 1691 | | 41 | 2005 | 5 | 1805 | | 42 | 2005 | 6 | 1776 | | 43 | 2005 | 7 | 1615 | | 44 | 2005 | 8 | 1613 | | 45 | 2005 | 9 | 1575 | | 46 | 2005 | 10 | 1632 | | 47 | 2005 | 11 | 1606 | | 48 | 2005 | 12 | 1703 | | 49 | 2006 | 1 | 1343 | | 50 | 2006 | 2 | 1279 | | 51 | 2006 | 3 | 1554 | | 52 | 2006 | 4 | 1755 | | 53 | 2006 | 5 | 2004 | | 54 | 2006 | 6 | 1877 | | 55 | 2006 | 7 | 1752 | | 56 | 2006 | 8 | 1726 | | 57 | 2006 | 9 | 1598 | | 58 | 2006 | 10 | 1654 | | 59 | 2006 | 11 | 1691 | | 60 | 2006 | 12 | 1750 | | 61 | 2007 | 1 | 1451 | | 62 | 2007 | 2 | 1380 | | 63 | 2007 | 3 | 1710 | | 64 | 2007 | 4 | 1777 | | 65 | 2007 | 5 | 2092 | | 66 | 2007 | 6 | 1965 | | 67 | 2007 | 7 | 1726 | | 68 | 2007 | 8 | 1735 | | 69 | 2007 | 9 | 1589 | | 70 | 2007 | 10 | 1667 | | 71 | 2007 | 11 | 1678 | | 72 | 2007 | 12 | 1739 | | 73 | 2008 | 1 | 1420 | | 74 | 2008 | 2 | 1340 | | 75 | 2008 | 3 | 1539 | | 76 | 2008 | 4 | 1806 | | 77 | 2008 | 5 | 2083 | | 78 | 2008 | 6 | 1968 | | 79 | 2008 | 7 | 1797 | | 80 | 2008 | 8 | 1698 | | 81 | 2008 | 9 | 1611 | | 82 | 2008 | 10 | 1695 | | 83 | 2008 | 11 | 1610 | | 84 | 2008 | 12 | 1677 | | 85 | 2009 | 1 | 1360 | | 86 | 2009 | 2 | 1244 | | 87 | 2009 | 3 | 1517 | | 88 | 2009 | 4 | 1753 | | 89 | 2009 | 5 | 1985 | | 90 | 2009 | 6 | 1788 | | 91 | 2009 | 7 | 1627 | | 92 | 2009 | 8 | 1545 | | 93 | 2009 | 9 | 1480 | | 94 | 2009 | 10 | 1573 | | 95 | 2009 | 11 | 1485 | | 96 | 2009 | 12 | 1649 | | 97 | 2010 | 1 | 1304 | | 98 | 2010 | 2 | 1259 | | 99 | 2010 | 3 | 1553 | | 100 | 2010 | 4 | 1777 | | 101 | 2010 | 5 | 1875 | | 102 | 2010 | 6 | 1761 | | 103 | 2010 | 7 | 1658 | | 104 | 2010 | 8 | 1544 | | 105 | 2010 | 9 | 1494 | | 106 | 2010 | 10 | 1564 | | 107 | 2010 | 11 | 1672 | | 108 | 2010 | 12 | 1741 | | 109 | 2011 | 1 | 1355 | | 110 | 2011 | 2 | 1272 | | 111 | 2011 | 3 | 1539 | | 112 | 2011 | 4 | 1796 | | 113 | 2011 | 5 | 2093 | | 114 | 2011 | 6 | 1977 | | 115 | 2011 | 7 | 1817 | | 116 | 2011 | 8 | 1842 | | 117 | 2011 | 9 | 1688 | | 118 | 2011 | 10 | 1774 | | 119 | 2011 | 11 | 1768 | | 120 | 2011 | 12 | 1800 | | 121 | 2012 | 1 | 1491 | | 122 | 2012 | 2 | 1432 | | 123 | 2012 | 3 | 1799 | | 124 | 2012 | 4 | 2023 | | 125 | 2012 | 5 | 2330 | | 126 | 2012 | 6 | 2035 | | 127 | 2012 | 7 | 1810 | | 128 | 2012 | 8 | 1771 | | 129 | 2012 | 9 | 1606 | | 130 | 2012 | 10 | 1804 | | 131 | 2012 | 11 | 1780 | | 132 | 2012 | 12 | 1753 | | 133 | 2013 | 1 | 1479 | | 134 | 2013 | 2 | 1402 | | 135 | 2013 | 3 | 1595 | | 136 | 2013 | 4 | 1825 | | 137 | 2013 | 5 | 1965 | | 138 | 2013 | 6 | 1844 | | 139 | 2013 | 7 | 1738 | | 140 | 2013 | 8 | 1726 | | 141 | 2013 | 9 | 1604 | | 142 | 2013 | 10 | 1744 | | 143 | 2013 | 11 | 1680 | | 144 | 2013 | 12 | 1730 | | 145 | 2014 | 1 | 1565 | | 146 | 2014 | 2 | 1497 | | 147 | 2014 | 3 | 1757 | | 148 | 2014 | 4 | 1877 | | 149 | 2014 | 5 | 2075 | | 150 | 2014 | 6 | 1925 | | 151 | 2014 | 7 | 1904 | | 152 | 2014 | 8 | 1848 | | 153 | 2014 | 9 | 1797 | | 154 | 2014 | 10 | 1956 | | 155 | 2014 | 11 | 1850 | | 156 | 2014 | 12 | 1931 | | 157 | 2015 | 1 | 1756 | | 158 | 2015 | 2 | 1686 | | 159 | 2015 | 3 | 1994 | | 160 | 2015 | 4 | 2162 | | 161 | 2015 | 5 | 2276 | | 162 | 2015 | 6 | 2144 | |
Are you looking for a holt-winters forecast? I am not sure as to what do you mean by HW time-series
However, this video may help if you are looking for holt-winters method.
https://www.youtube.com/watch?v=qpiWJaeJPtA
If you have further doubts or need clarifications, feel free to ask.


 Homework Sourse