For the data given Fit a least squares line to the data Plo
For the data given :
-Fit a least squares line to the data.
-Plot the data and graph the line.
-Calculate r and r2; interpret their values.
-Is the model useful (90% confidence interval) for predicting y?
-Estimate y given x = 10. Use a 90% confidence interval
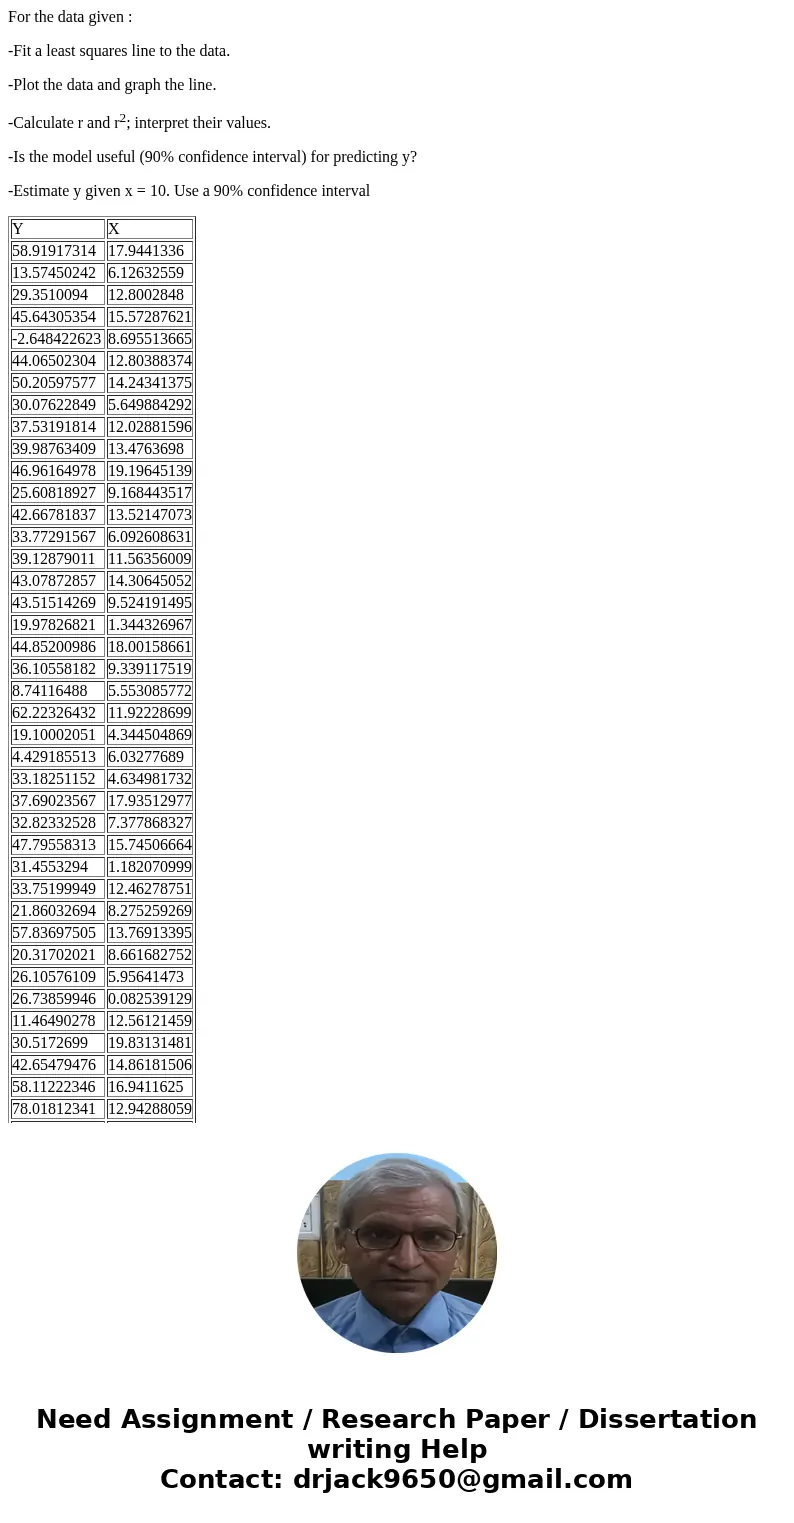
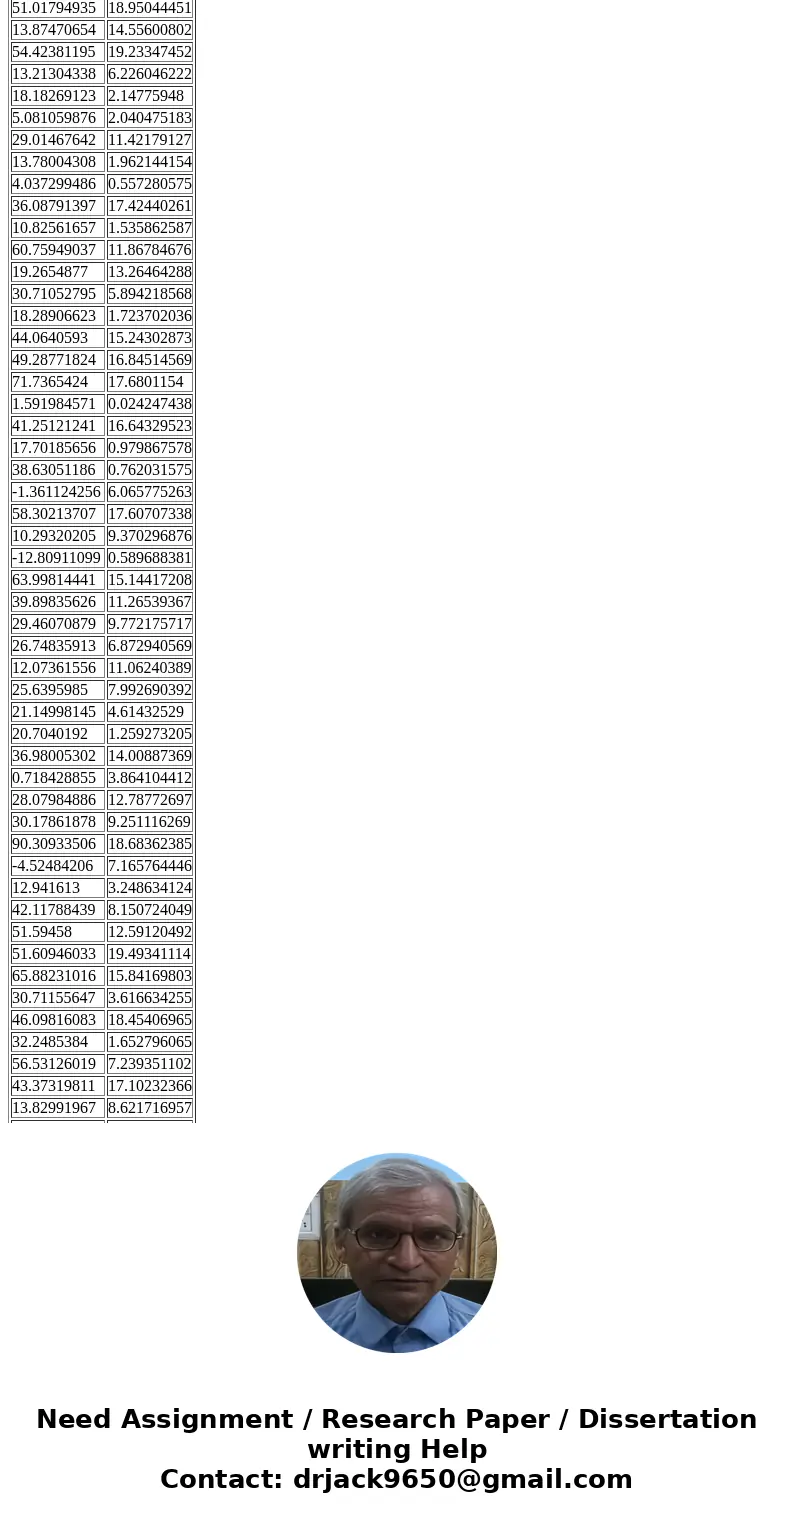
| Y | X |
| 58.91917314 | 17.9441336 |
| 13.57450242 | 6.12632559 |
| 29.3510094 | 12.8002848 |
| 45.64305354 | 15.57287621 |
| -2.648422623 | 8.695513665 |
| 44.06502304 | 12.80388374 |
| 50.20597577 | 14.24341375 |
| 30.07622849 | 5.649884292 |
| 37.53191814 | 12.02881596 |
| 39.98763409 | 13.4763698 |
| 46.96164978 | 19.19645139 |
| 25.60818927 | 9.168443517 |
| 42.66781837 | 13.52147073 |
| 33.77291567 | 6.092608631 |
| 39.12879011 | 11.56356009 |
| 43.07872857 | 14.30645052 |
| 43.51514269 | 9.524191495 |
| 19.97826821 | 1.344326967 |
| 44.85200986 | 18.00158661 |
| 36.10558182 | 9.339117519 |
| 8.74116488 | 5.553085772 |
| 62.22326432 | 11.92228699 |
| 19.10002051 | 4.344504869 |
| 4.429185513 | 6.03277689 |
| 33.18251152 | 4.634981732 |
| 37.69023567 | 17.93512977 |
| 32.82332528 | 7.377868327 |
| 47.79558313 | 15.74506664 |
| 31.4553294 | 1.182070999 |
| 33.75199949 | 12.46278751 |
| 21.86032694 | 8.275259269 |
| 57.83697505 | 13.76913395 |
| 20.31702021 | 8.661682752 |
| 26.10576109 | 5.95641473 |
| 26.73859946 | 0.082539129 |
| 11.46490278 | 12.56121459 |
| 30.5172699 | 19.83131481 |
| 42.65479476 | 14.86181506 |
| 58.11222346 | 16.9411625 |
| 78.01812341 | 12.94288059 |
| 51.01794935 | 18.95044451 |
| 13.87470654 | 14.55600802 |
| 54.42381195 | 19.23347452 |
| 13.21304338 | 6.226046222 |
| 18.18269123 | 2.14775948 |
| 5.081059876 | 2.040475183 |
| 29.01467642 | 11.42179127 |
| 13.78004308 | 1.962144154 |
| 4.037299486 | 0.557280575 |
| 36.08791397 | 17.42440261 |
| 10.82561657 | 1.535862587 |
| 60.75949037 | 11.86784676 |
| 19.2654877 | 13.26464288 |
| 30.71052795 | 5.894218568 |
| 18.28906623 | 1.723702036 |
| 44.0640593 | 15.24302873 |
| 49.28771824 | 16.84514569 |
| 71.7365424 | 17.6801154 |
| 1.591984571 | 0.024247438 |
| 41.25121241 | 16.64329523 |
| 17.70185656 | 0.979867578 |
| 38.63051186 | 0.762031575 |
| -1.361124256 | 6.065775263 |
| 58.30213707 | 17.60707338 |
| 10.29320205 | 9.370296876 |
| -12.80911099 | 0.589688381 |
| 63.99814441 | 15.14417208 |
| 39.89835626 | 11.26539367 |
| 29.46070879 | 9.772175717 |
| 26.74835913 | 6.872940569 |
| 12.07361556 | 11.06240389 |
| 25.6395985 | 7.992690392 |
| 21.14998145 | 4.61432529 |
| 20.7040192 | 1.259273205 |
| 36.98005302 | 14.00887369 |
| 0.718428855 | 3.864104412 |
| 28.07984886 | 12.78772697 |
| 30.17861878 | 9.251116269 |
| 90.30933506 | 18.68362385 |
| -4.52484206 | 7.165764446 |
| 12.941613 | 3.248634124 |
| 42.11788439 | 8.150724049 |
| 51.59458 | 12.59120492 |
| 51.60946033 | 19.49341114 |
| 65.88231016 | 15.84169803 |
| 30.71155647 | 3.616634255 |
| 46.09816083 | 18.45406965 |
| 32.2485384 | 1.652796065 |
| 56.53126019 | 7.239351102 |
| 43.37319811 | 17.10232366 |
| 13.82991967 | 8.621716957 |
| 20.58527511 | 5.292266003 |
| 56.462476 | 14.62785029 |
| 36.2813413 | 15.16897518 |
| 14.05597424 | 3.870469984 |
| 29.26498968 | 12.70525191 |
| 41.37653997 | 9.339120222 |
| 23.19082164 | 7.864050797 |
| 8.636308408 | 1.909121706 |
| 23.70099472 | 8.285990079 |
| 23.97055423 | 11.4312186 |
Solution
The equation of the line best fit is given as:
Y = 2.2755 X + 9.5767
R = 0.67772
R2 = 0.4593
The values of R and R2 are pretty low. So, the model is not very accurate in predicting. the R2 determines the amount of regression explained by this line.
For X = 10, we have the predicted value of Y as:
Y-hat = (2.2755 * 10) + 9.5769
= 32.331
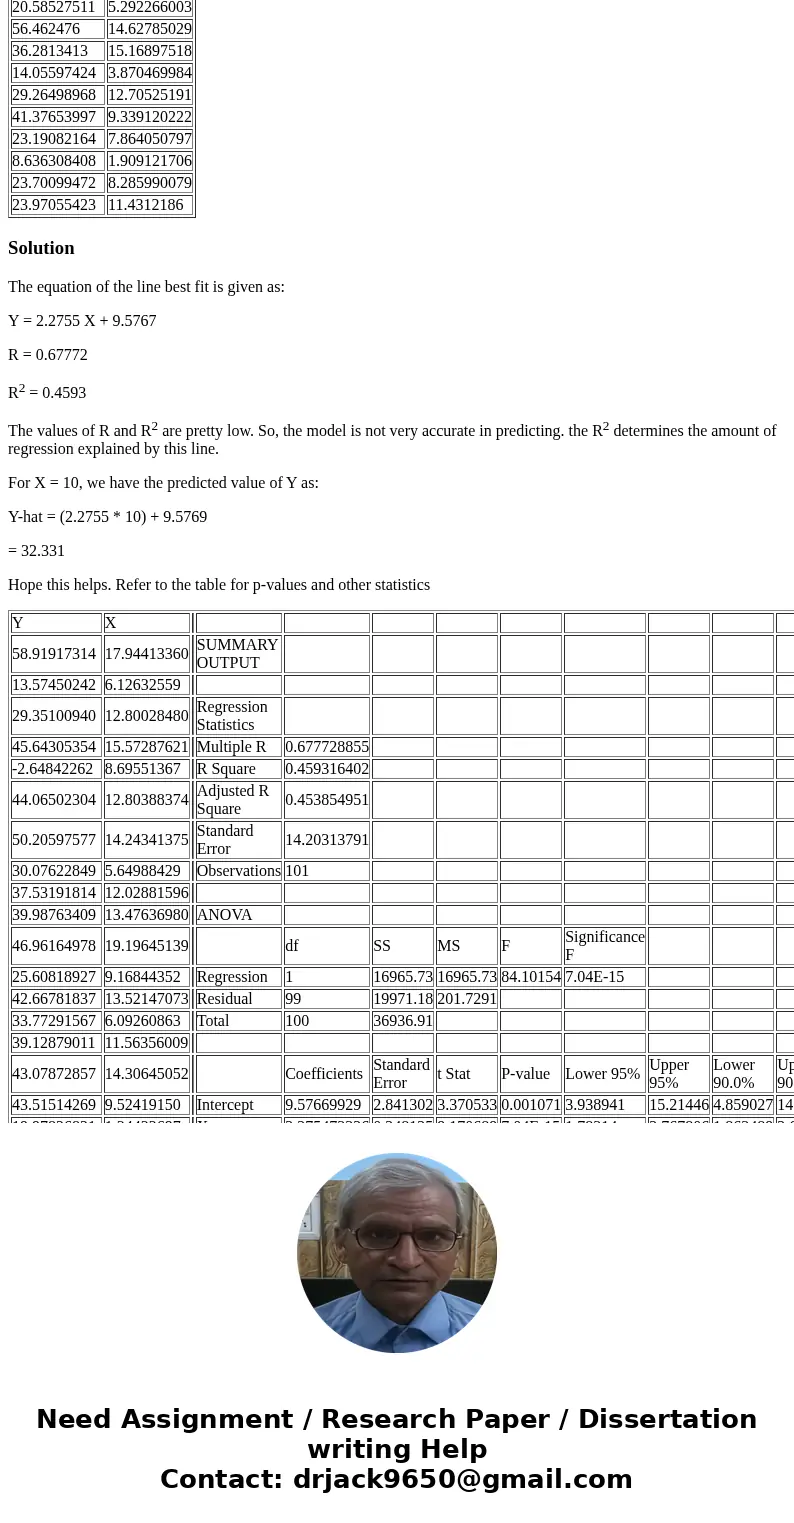
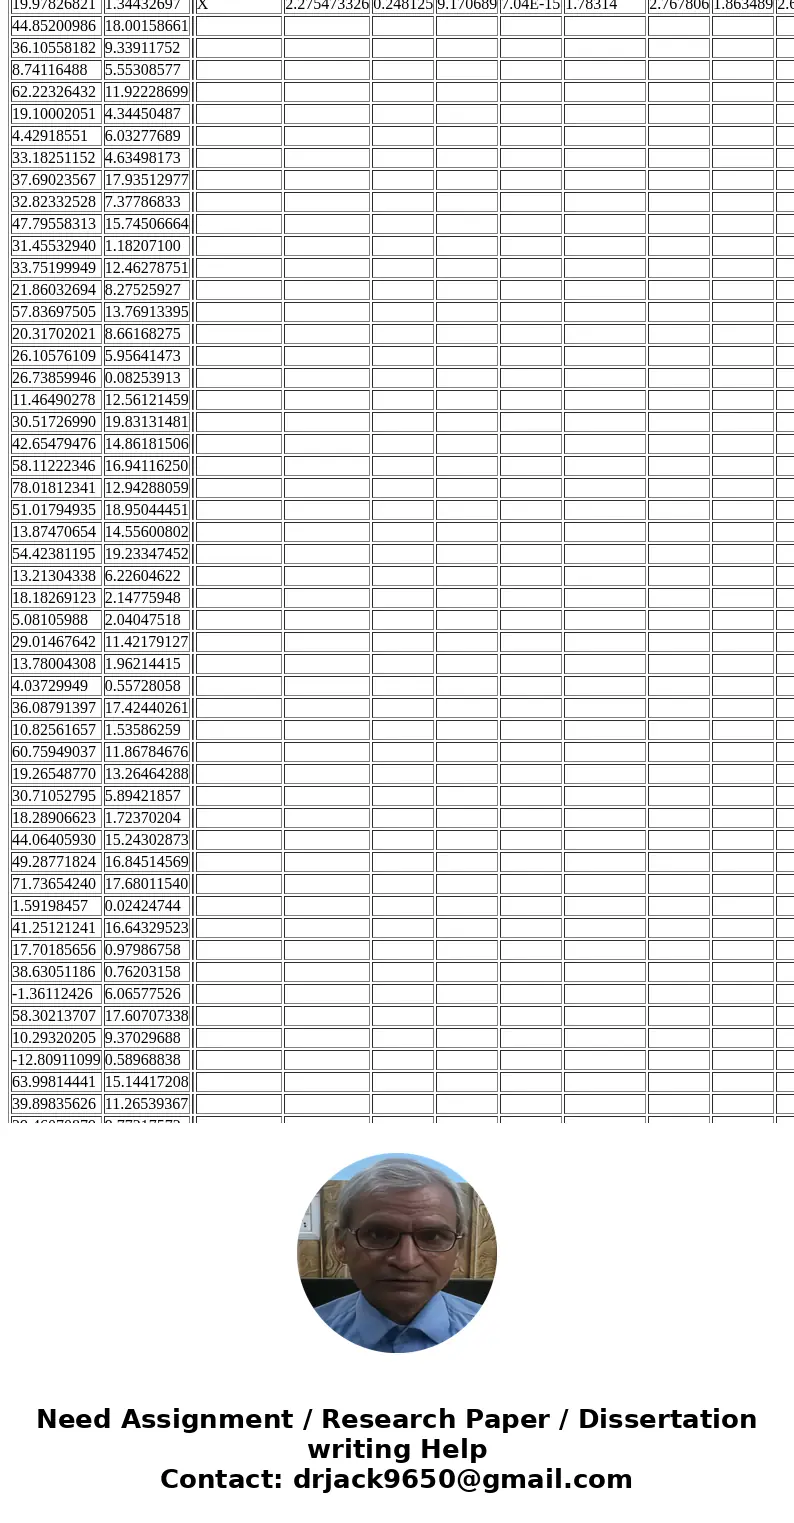
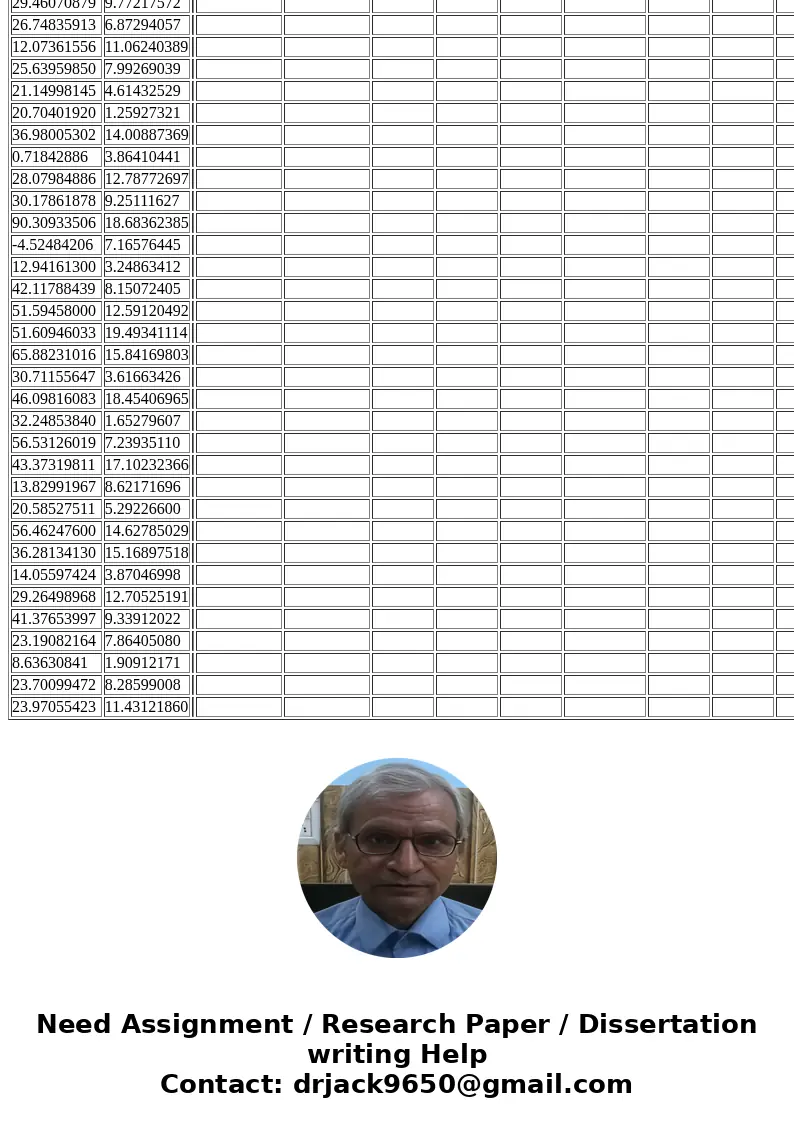
Hope this helps. Refer to the table for p-values and other statistics
| Y | X | | ||||||||||
| 58.91917314 | 17.94413360 | SUMMARY OUTPUT | ||||||||||
| 13.57450242 | 6.12632559 | |||||||||||
| 29.35100940 | 12.80028480 | Regression Statistics | ||||||||||
| 45.64305354 | 15.57287621 | Multiple R | 0.677728855 | |||||||||
| -2.64842262 | 8.69551367 | R Square | 0.459316402 | |||||||||
| 44.06502304 | 12.80388374 | Adjusted R Square | 0.453854951 | |||||||||
| 50.20597577 | 14.24341375 | Standard Error | 14.20313791 | |||||||||
| 30.07622849 | 5.64988429 | Observations | 101 | |||||||||
| 37.53191814 | 12.02881596 | |||||||||||
| 39.98763409 | 13.47636980 | ANOVA | ||||||||||
| 46.96164978 | 19.19645139 | df | SS | MS | F | Significance F | ||||||
| 25.60818927 | 9.16844352 | Regression | 1 | 16965.73 | 16965.73 | 84.10154 | 7.04E-15 | |||||
| 42.66781837 | 13.52147073 | Residual | 99 | 19971.18 | 201.7291 | |||||||
| 33.77291567 | 6.09260863 | Total | 100 | 36936.91 | ||||||||
| 39.12879011 | 11.56356009 | |||||||||||
| 43.07872857 | 14.30645052 | Coefficients | Standard Error | t Stat | P-value | Lower 95% | Upper 95% | Lower 90.0% | Upper 90.0% | |||
| 43.51514269 | 9.52419150 | Intercept | 9.57669929 | 2.841302 | 3.370533 | 0.001071 | 3.938941 | 15.21446 | 4.859027 | 14.29437 | ||
| 19.97826821 | 1.34432697 | X | 2.275473326 | 0.248125 | 9.170689 | 7.04E-15 | 1.78314 | 2.767806 | 1.863489 | 2.687457 | ||
| 44.85200986 | 18.00158661 | |||||||||||
| 36.10558182 | 9.33911752 | |||||||||||
| 8.74116488 | 5.55308577 | |||||||||||
| 62.22326432 | 11.92228699 | |||||||||||
| 19.10002051 | 4.34450487 | |||||||||||
| 4.42918551 | 6.03277689 | |||||||||||
| 33.18251152 | 4.63498173 | |||||||||||
| 37.69023567 | 17.93512977 | |||||||||||
| 32.82332528 | 7.37786833 | |||||||||||
| 47.79558313 | 15.74506664 | |||||||||||
| 31.45532940 | 1.18207100 | |||||||||||
| 33.75199949 | 12.46278751 | |||||||||||
| 21.86032694 | 8.27525927 | |||||||||||
| 57.83697505 | 13.76913395 | |||||||||||
| 20.31702021 | 8.66168275 | |||||||||||
| 26.10576109 | 5.95641473 | |||||||||||
| 26.73859946 | 0.08253913 | |||||||||||
| 11.46490278 | 12.56121459 | |||||||||||
| 30.51726990 | 19.83131481 | |||||||||||
| 42.65479476 | 14.86181506 | |||||||||||
| 58.11222346 | 16.94116250 | |||||||||||
| 78.01812341 | 12.94288059 | |||||||||||
| 51.01794935 | 18.95044451 | |||||||||||
| 13.87470654 | 14.55600802 | |||||||||||
| 54.42381195 | 19.23347452 | |||||||||||
| 13.21304338 | 6.22604622 | |||||||||||
| 18.18269123 | 2.14775948 | |||||||||||
| 5.08105988 | 2.04047518 | |||||||||||
| 29.01467642 | 11.42179127 | |||||||||||
| 13.78004308 | 1.96214415 | |||||||||||
| 4.03729949 | 0.55728058 | |||||||||||
| 36.08791397 | 17.42440261 | |||||||||||
| 10.82561657 | 1.53586259 | |||||||||||
| 60.75949037 | 11.86784676 | |||||||||||
| 19.26548770 | 13.26464288 | |||||||||||
| 30.71052795 | 5.89421857 | |||||||||||
| 18.28906623 | 1.72370204 | |||||||||||
| 44.06405930 | 15.24302873 | |||||||||||
| 49.28771824 | 16.84514569 | |||||||||||
| 71.73654240 | 17.68011540 | |||||||||||
| 1.59198457 | 0.02424744 | |||||||||||
| 41.25121241 | 16.64329523 | |||||||||||
| 17.70185656 | 0.97986758 | |||||||||||
| 38.63051186 | 0.76203158 | |||||||||||
| -1.36112426 | 6.06577526 | |||||||||||
| 58.30213707 | 17.60707338 | |||||||||||
| 10.29320205 | 9.37029688 | |||||||||||
| -12.80911099 | 0.58968838 | |||||||||||
| 63.99814441 | 15.14417208 | |||||||||||
| 39.89835626 | 11.26539367 | |||||||||||
| 29.46070879 | 9.77217572 | |||||||||||
| 26.74835913 | 6.87294057 | |||||||||||
| 12.07361556 | 11.06240389 | |||||||||||
| 25.63959850 | 7.99269039 | |||||||||||
| 21.14998145 | 4.61432529 | |||||||||||
| 20.70401920 | 1.25927321 | |||||||||||
| 36.98005302 | 14.00887369 | |||||||||||
| 0.71842886 | 3.86410441 | |||||||||||
| 28.07984886 | 12.78772697 | |||||||||||
| 30.17861878 | 9.25111627 | |||||||||||
| 90.30933506 | 18.68362385 | |||||||||||
| -4.52484206 | 7.16576445 | |||||||||||
| 12.94161300 | 3.24863412 | |||||||||||
| 42.11788439 | 8.15072405 | |||||||||||
| 51.59458000 | 12.59120492 | |||||||||||
| 51.60946033 | 19.49341114 | |||||||||||
| 65.88231016 | 15.84169803 | |||||||||||
| 30.71155647 | 3.61663426 | |||||||||||
| 46.09816083 | 18.45406965 | |||||||||||
| 32.24853840 | 1.65279607 | |||||||||||
| 56.53126019 | 7.23935110 | |||||||||||
| 43.37319811 | 17.10232366 | |||||||||||
| 13.82991967 | 8.62171696 | |||||||||||
| 20.58527511 | 5.29226600 | |||||||||||
| 56.46247600 | 14.62785029 | |||||||||||
| 36.28134130 | 15.16897518 | |||||||||||
| 14.05597424 | 3.87046998 | |||||||||||
| 29.26498968 | 12.70525191 | |||||||||||
| 41.37653997 | 9.33912022 | |||||||||||
| 23.19082164 | 7.86405080 | |||||||||||
| 8.63630841 | 1.90912171 | |||||||||||
| 23.70099472 | 8.28599008 | |||||||||||
| 23.97055423 | 11.43121860 |
 Homework Sourse