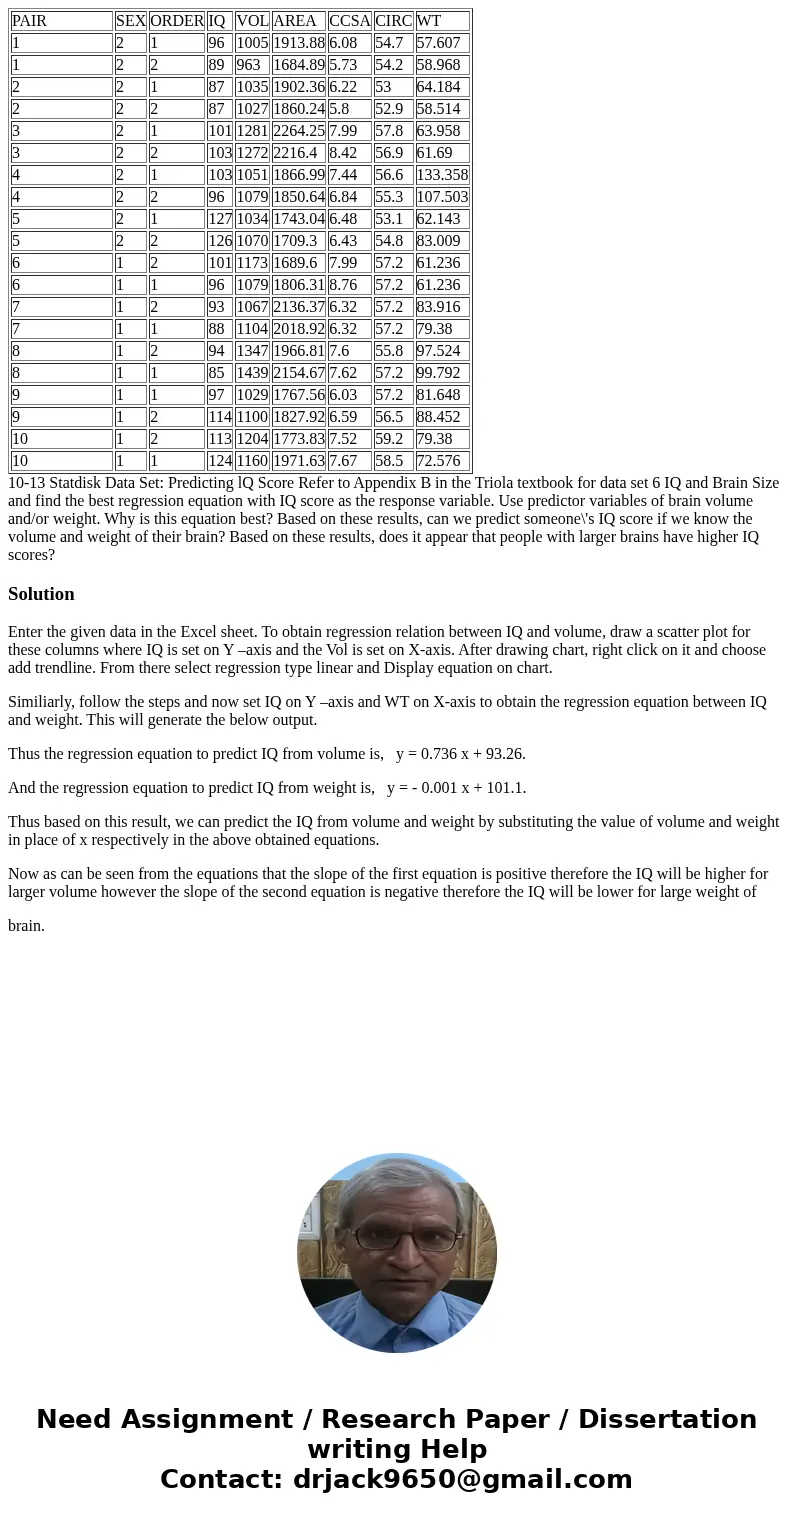
PAIR SEX ORDER IQ VOL AREA CCSA CIRC WT 1 2 1 96 1005 191388
| PAIR | SEX | ORDER | IQ | VOL | AREA | CCSA | CIRC | WT |
| 1 | 2 | 1 | 96 | 1005 | 1913.88 | 6.08 | 54.7 | 57.607 |
| 1 | 2 | 2 | 89 | 963 | 1684.89 | 5.73 | 54.2 | 58.968 |
| 2 | 2 | 1 | 87 | 1035 | 1902.36 | 6.22 | 53 | 64.184 |
| 2 | 2 | 2 | 87 | 1027 | 1860.24 | 5.8 | 52.9 | 58.514 |
| 3 | 2 | 1 | 101 | 1281 | 2264.25 | 7.99 | 57.8 | 63.958 |
| 3 | 2 | 2 | 103 | 1272 | 2216.4 | 8.42 | 56.9 | 61.69 |
| 4 | 2 | 1 | 103 | 1051 | 1866.99 | 7.44 | 56.6 | 133.358 |
| 4 | 2 | 2 | 96 | 1079 | 1850.64 | 6.84 | 55.3 | 107.503 |
| 5 | 2 | 1 | 127 | 1034 | 1743.04 | 6.48 | 53.1 | 62.143 |
| 5 | 2 | 2 | 126 | 1070 | 1709.3 | 6.43 | 54.8 | 83.009 |
| 6 | 1 | 2 | 101 | 1173 | 1689.6 | 7.99 | 57.2 | 61.236 |
| 6 | 1 | 1 | 96 | 1079 | 1806.31 | 8.76 | 57.2 | 61.236 |
| 7 | 1 | 2 | 93 | 1067 | 2136.37 | 6.32 | 57.2 | 83.916 |
| 7 | 1 | 1 | 88 | 1104 | 2018.92 | 6.32 | 57.2 | 79.38 |
| 8 | 1 | 2 | 94 | 1347 | 1966.81 | 7.6 | 55.8 | 97.524 |
| 8 | 1 | 1 | 85 | 1439 | 2154.67 | 7.62 | 57.2 | 99.792 |
| 9 | 1 | 1 | 97 | 1029 | 1767.56 | 6.03 | 57.2 | 81.648 |
| 9 | 1 | 2 | 114 | 1100 | 1827.92 | 6.59 | 56.5 | 88.452 |
| 10 | 1 | 2 | 113 | 1204 | 1773.83 | 7.52 | 59.2 | 79.38 |
| 10 | 1 | 1 | 124 | 1160 | 1971.63 | 7.67 | 58.5 | 72.576 |
Solution
Enter the given data in the Excel sheet. To obtain regression relation between IQ and volume, draw a scatter plot for these columns where IQ is set on Y –axis and the Vol is set on X-axis. After drawing chart, right click on it and choose add trendline. From there select regression type linear and Display equation on chart.
Similiarly, follow the steps and now set IQ on Y –axis and WT on X-axis to obtain the regression equation between IQ and weight. This will generate the below output.
Thus the regression equation to predict IQ from volume is, y = 0.736 x + 93.26.
And the regression equation to predict IQ from weight is, y = - 0.001 x + 101.1.
Thus based on this result, we can predict the IQ from volume and weight by substituting the value of volume and weight in place of x respectively in the above obtained equations.
Now as can be seen from the equations that the slope of the first equation is positive therefore the IQ will be higher for larger volume however the slope of the second equation is negative therefore the IQ will be lower for large weight of
brain.

 Homework Sourse