The following table summarizes the results of a twofactor AN
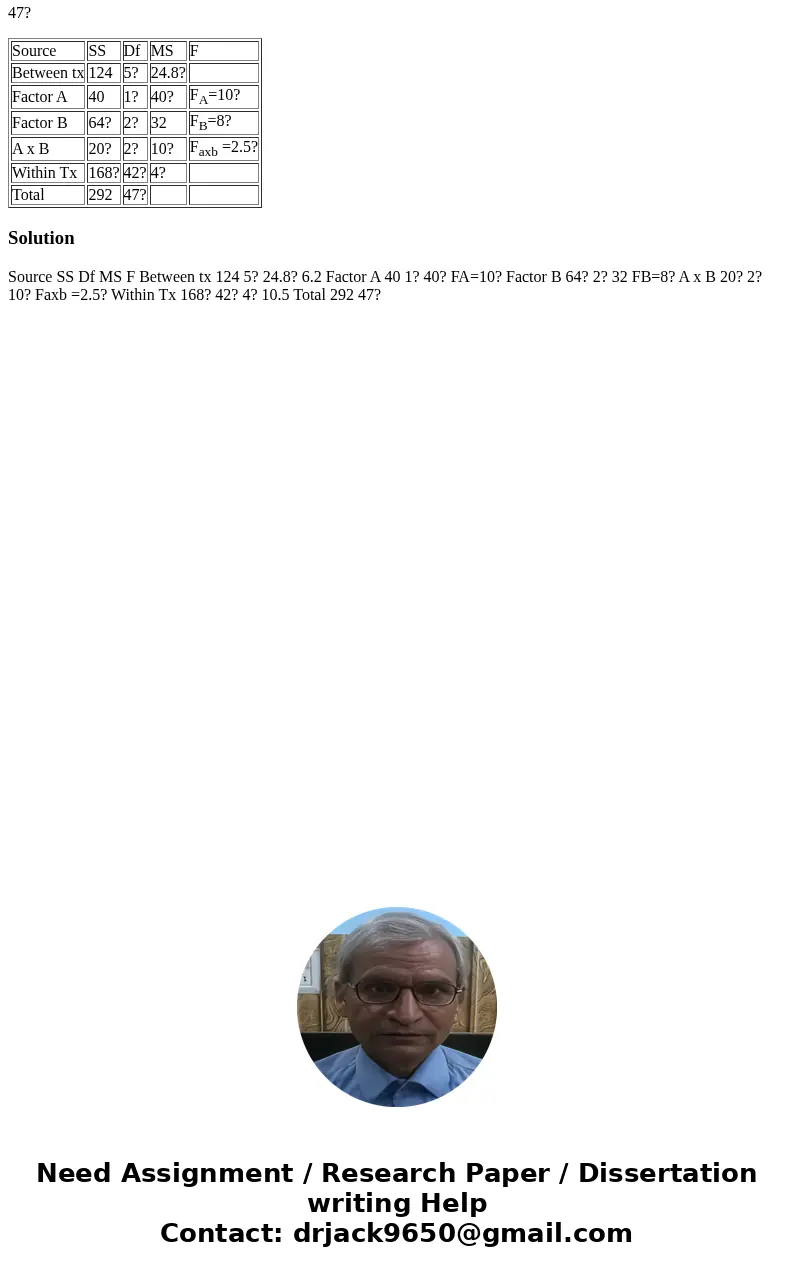
The following table summarizes the results of a two-factor ANOVA evaluating an independent-measures experiment with two levels of factor A, three levels of factor B, and n = 8 participants in each treatment condition
Based on the information how would you fill the chart?
Source
SS
Df
MS
F
Between tx
124
5?
24.8?
Factor A
40
1?
40?
FA=10?
Factor B
64?
2?
32
FB=8?
A x B
20?
2?
10?
Faxb =2.5?
Within Tx
168?
42?
4?
Total
292
47?
| Source | SS | Df | MS | F |
| Between tx | 124 | 5? | 24.8? | |
| Factor A | 40 | 1? | 40? | FA=10? |
| Factor B | 64? | 2? | 32 | FB=8? |
| A x B | 20? | 2? | 10? | Faxb =2.5? |
| Within Tx | 168? | 42? | 4? | |
| Total | 292 | 47? |
Solution
Source SS Df MS F Between tx 124 5? 24.8? 6.2 Factor A 40 1? 40? FA=10? Factor B 64? 2? 32 FB=8? A x B 20? 2? 10? Faxb =2.5? Within Tx 168? 42? 4? 10.5 Total 292 47?
 Homework Sourse