Use the following data for Question 69 A manufacturer uses 2
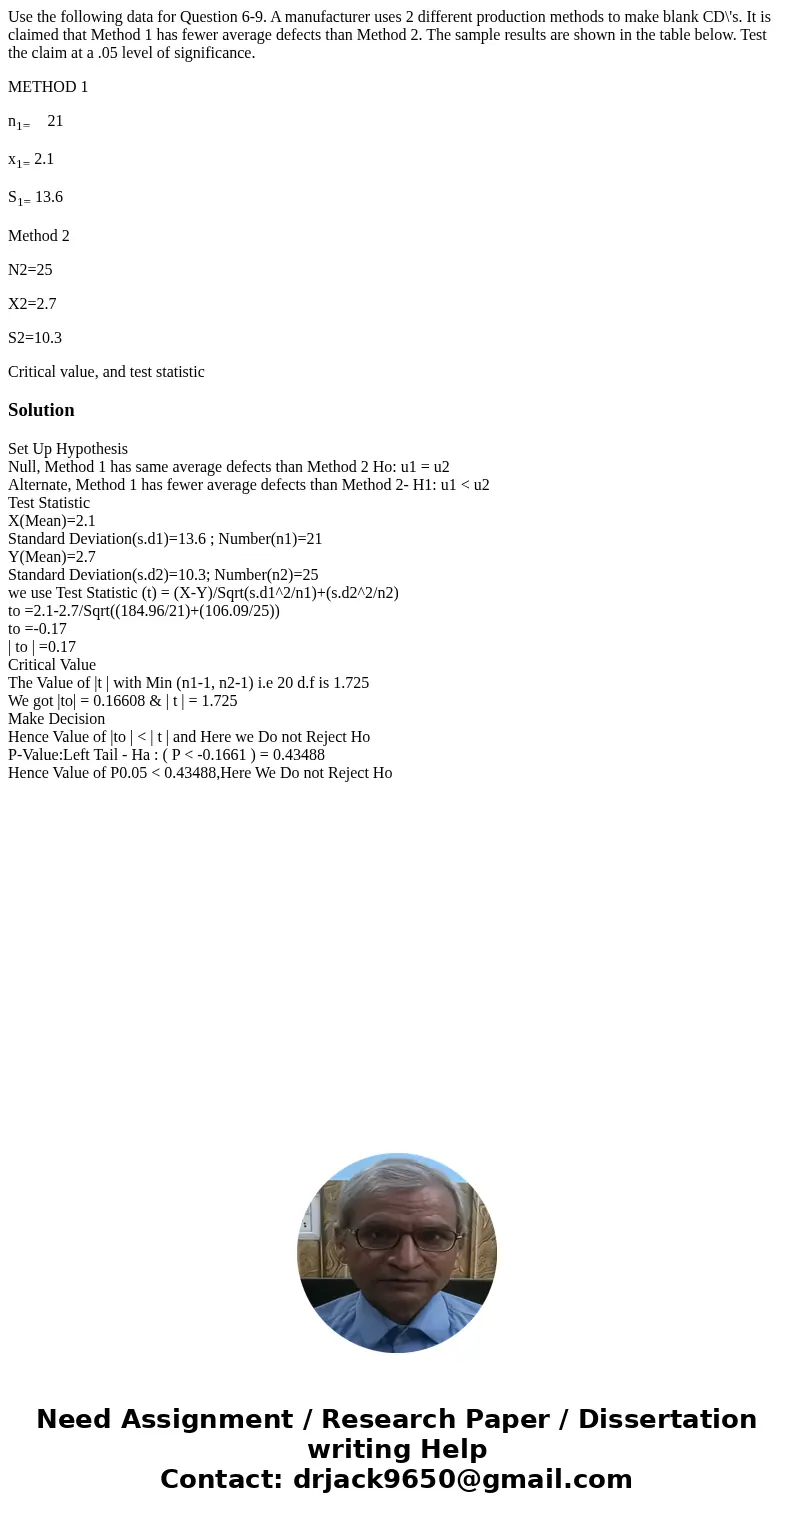
Use the following data for Question 6-9. A manufacturer uses 2 different production methods to make blank CD\'s. It is claimed that Method 1 has fewer average defects than Method 2. The sample results are shown in the table below. Test the claim at a .05 level of significance.
METHOD 1
n1= 21
x1= 2.1
S1= 13.6
Method 2
N2=25
X2=2.7
S2=10.3
Critical value, and test statistic
Solution
Set Up Hypothesis
Null, Method 1 has same average defects than Method 2 Ho: u1 = u2
Alternate, Method 1 has fewer average defects than Method 2- H1: u1 < u2
Test Statistic
X(Mean)=2.1
Standard Deviation(s.d1)=13.6 ; Number(n1)=21
Y(Mean)=2.7
Standard Deviation(s.d2)=10.3; Number(n2)=25
we use Test Statistic (t) = (X-Y)/Sqrt(s.d1^2/n1)+(s.d2^2/n2)
to =2.1-2.7/Sqrt((184.96/21)+(106.09/25))
to =-0.17
| to | =0.17
Critical Value
The Value of |t | with Min (n1-1, n2-1) i.e 20 d.f is 1.725
We got |to| = 0.16608 & | t | = 1.725
Make Decision
Hence Value of |to | < | t | and Here we Do not Reject Ho
P-Value:Left Tail - Ha : ( P < -0.1661 ) = 0.43488
Hence Value of P0.05 < 0.43488,Here We Do not Reject Ho

 Homework Sourse