A random sample of 15 high schools gave the following inform
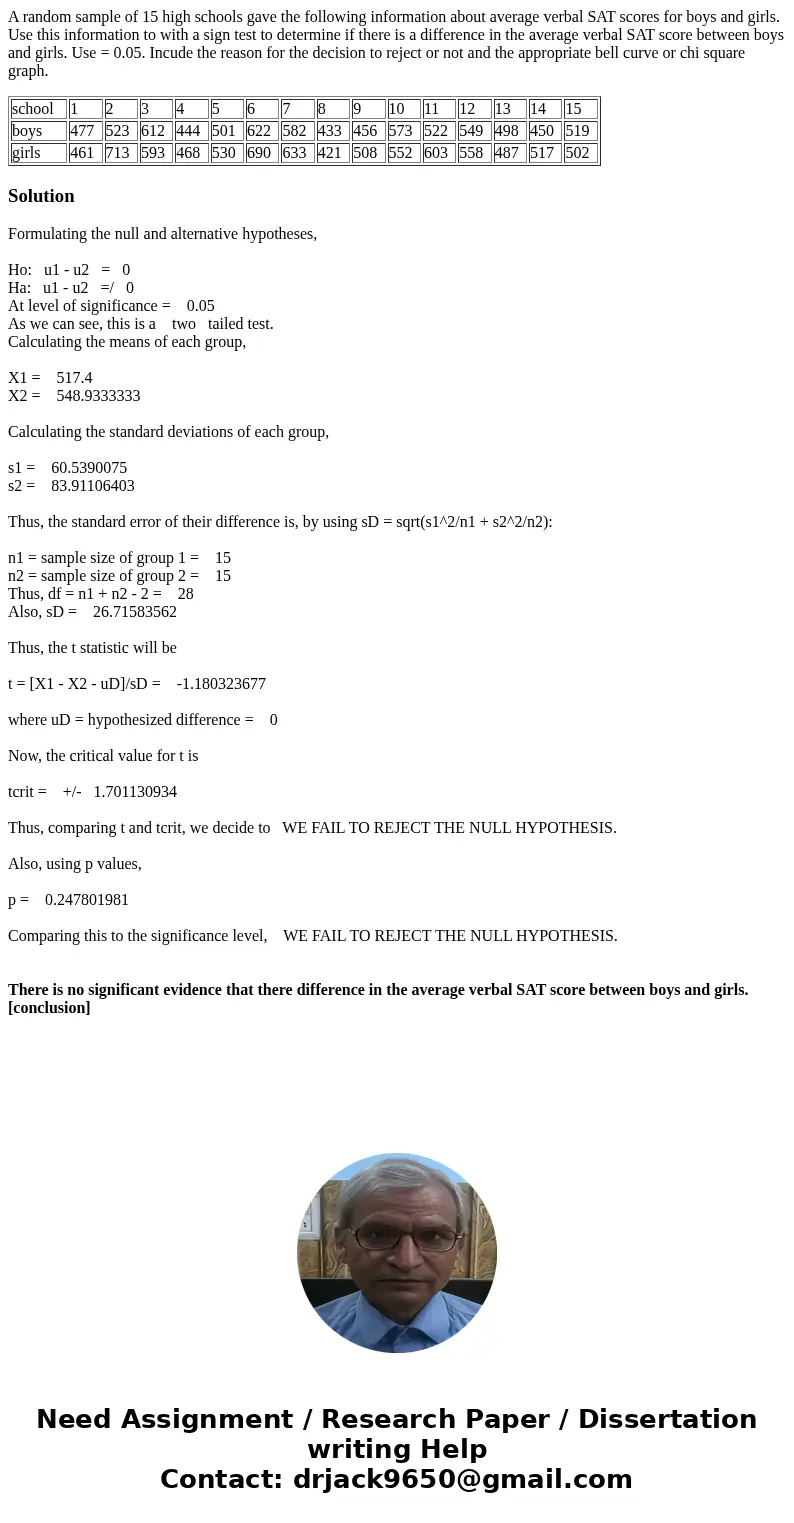
A random sample of 15 high schools gave the following information about average verbal SAT scores for boys and girls. Use this information to with a sign test to determine if there is a difference in the average verbal SAT score between boys and girls. Use = 0.05. Incude the reason for the decision to reject or not and the appropriate bell curve or chi square graph.
| school | 1 | 2 | 3 | 4 | 5 | 6 | 7 | 8 | 9 | 10 | 11 | 12 | 13 | 14 | 15 |
| boys | 477 | 523 | 612 | 444 | 501 | 622 | 582 | 433 | 456 | 573 | 522 | 549 | 498 | 450 | 519 |
| girls | 461 | 713 | 593 | 468 | 530 | 690 | 633 | 421 | 508 | 552 | 603 | 558 | 487 | 517 | 502 |
Solution
Formulating the null and alternative hypotheses,
Ho: u1 - u2 = 0
Ha: u1 - u2 =/ 0
At level of significance = 0.05
As we can see, this is a two tailed test.
Calculating the means of each group,
X1 = 517.4
X2 = 548.9333333
Calculating the standard deviations of each group,
s1 = 60.5390075
s2 = 83.91106403
Thus, the standard error of their difference is, by using sD = sqrt(s1^2/n1 + s2^2/n2):
n1 = sample size of group 1 = 15
n2 = sample size of group 2 = 15
Thus, df = n1 + n2 - 2 = 28
Also, sD = 26.71583562
Thus, the t statistic will be
t = [X1 - X2 - uD]/sD = -1.180323677
where uD = hypothesized difference = 0
Now, the critical value for t is
tcrit = +/- 1.701130934
Thus, comparing t and tcrit, we decide to WE FAIL TO REJECT THE NULL HYPOTHESIS.
Also, using p values,
p = 0.247801981
Comparing this to the significance level, WE FAIL TO REJECT THE NULL HYPOTHESIS.
There is no significant evidence that there difference in the average verbal SAT score between boys and girls. [conclusion]

 Homework Sourse