Data on the following slide are the vehicle arrival times at
Solution
Data on the following slide are the vehicle arrival times at a stop sign.
The total time span of the recording was T=240 minutes.
The average rate is,
= sum of observations / total number of observations.
= 5711.9 / 44 = 129.8159
The Inter arrival time is difference between arrival times.
For example :
25 - 7 = 18
26.1 - 25 = 1.1
26.4 - 26.1 = 0.3 etc...
Let X be the arrival time at a stop sign.
X ~ Poisson ( = 129.8159)
And let Y be the inter arrival time.
Y follows Exponential distribution.
Use 1-minute for the exponential inter arrival times.
that is the width of the class interval is 1.
Minimum of the inter arrival time is 0 and maximum of the inter arrival time is 21.
So the first class is 0 - 1 second class is 0 - 2 and so on...
Use 10 minutes intervals for the Poisson.
minimum of the arrival time is 7.
Maximum of the arrival time is 238.
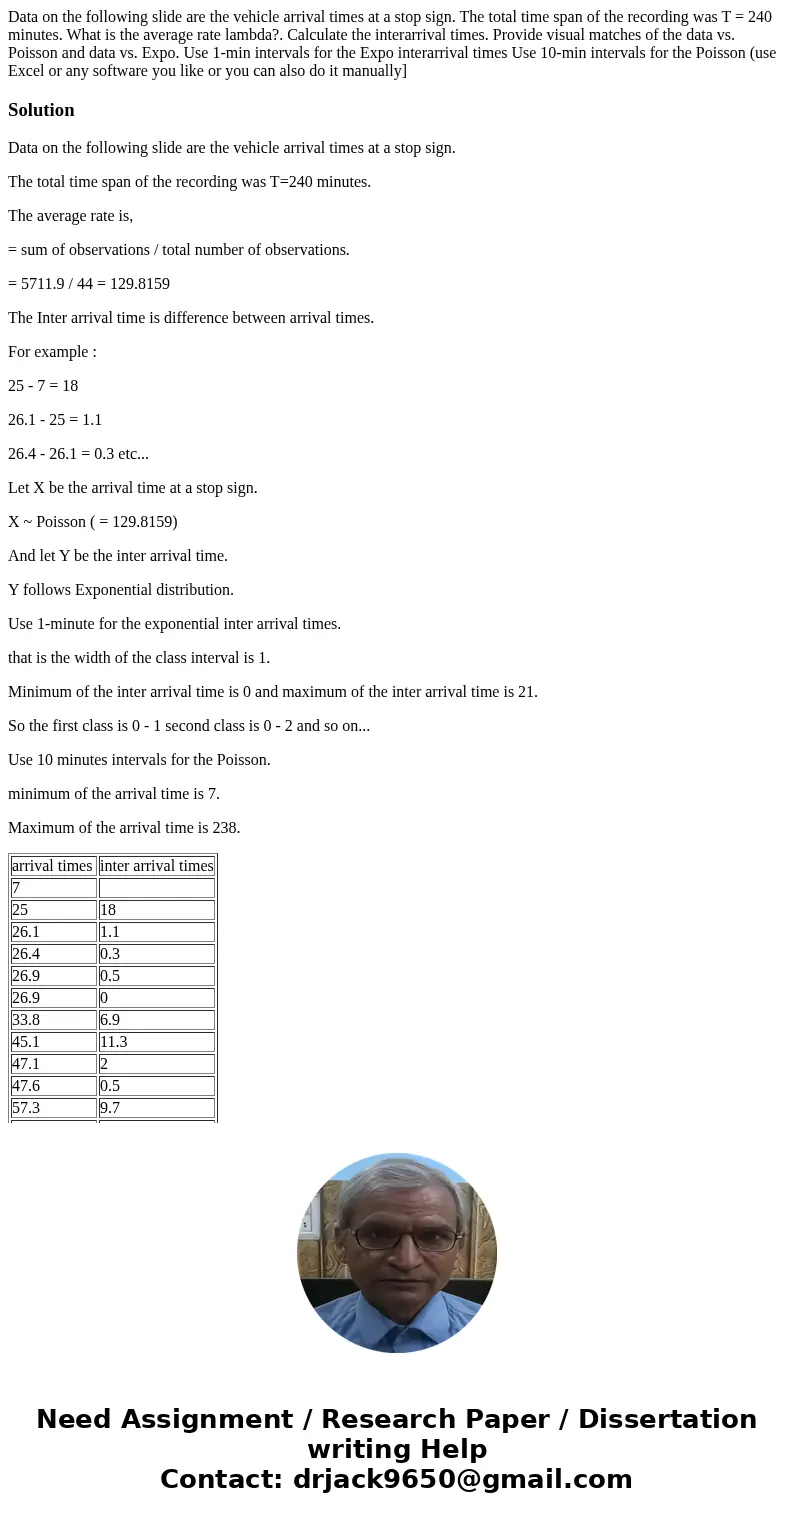
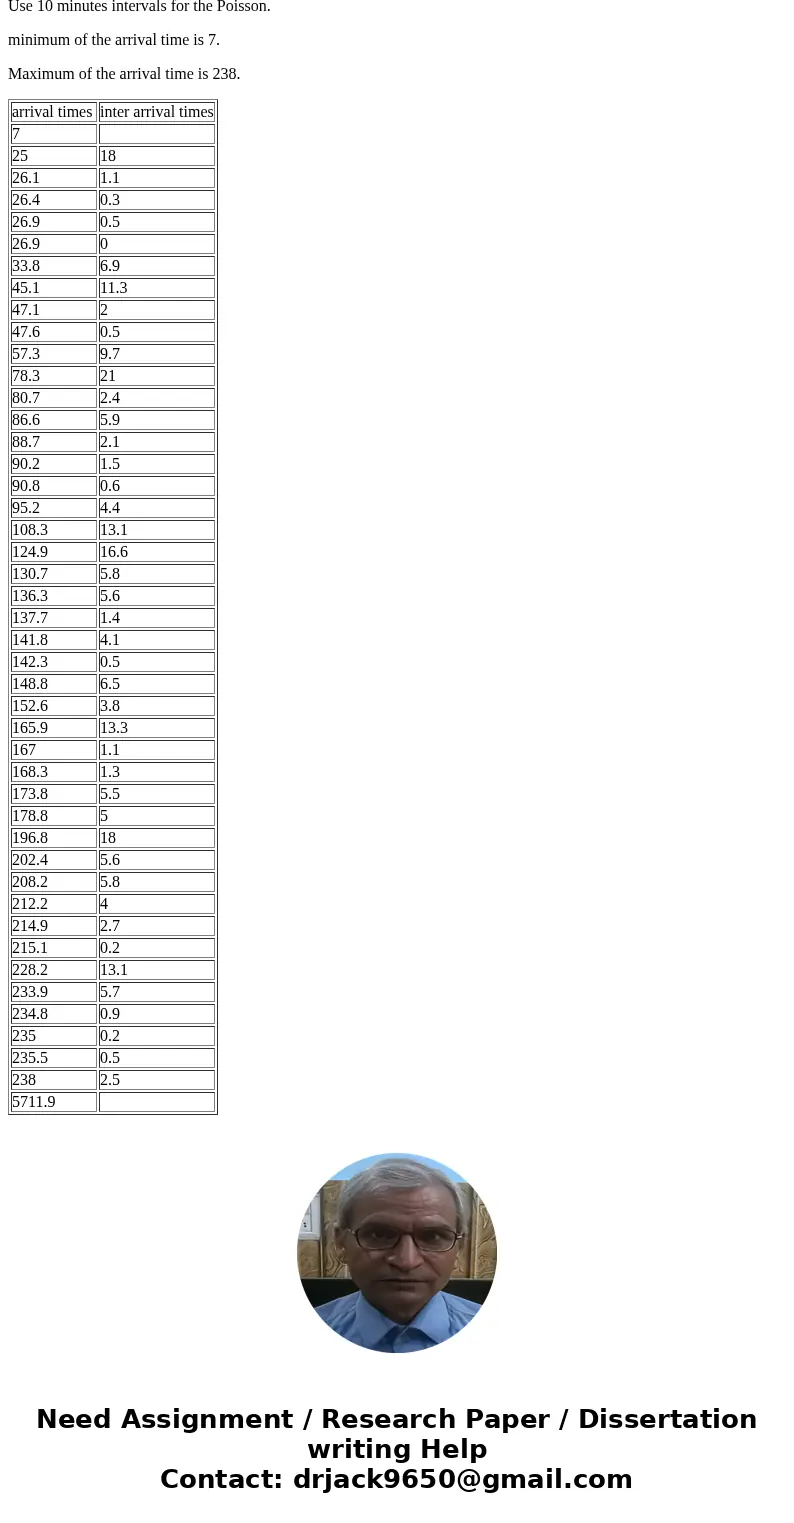
| arrival times | inter arrival times |
| 7 | |
| 25 | 18 |
| 26.1 | 1.1 |
| 26.4 | 0.3 |
| 26.9 | 0.5 |
| 26.9 | 0 |
| 33.8 | 6.9 |
| 45.1 | 11.3 |
| 47.1 | 2 |
| 47.6 | 0.5 |
| 57.3 | 9.7 |
| 78.3 | 21 |
| 80.7 | 2.4 |
| 86.6 | 5.9 |
| 88.7 | 2.1 |
| 90.2 | 1.5 |
| 90.8 | 0.6 |
| 95.2 | 4.4 |
| 108.3 | 13.1 |
| 124.9 | 16.6 |
| 130.7 | 5.8 |
| 136.3 | 5.6 |
| 137.7 | 1.4 |
| 141.8 | 4.1 |
| 142.3 | 0.5 |
| 148.8 | 6.5 |
| 152.6 | 3.8 |
| 165.9 | 13.3 |
| 167 | 1.1 |
| 168.3 | 1.3 |
| 173.8 | 5.5 |
| 178.8 | 5 |
| 196.8 | 18 |
| 202.4 | 5.6 |
| 208.2 | 5.8 |
| 212.2 | 4 |
| 214.9 | 2.7 |
| 215.1 | 0.2 |
| 228.2 | 13.1 |
| 233.9 | 5.7 |
| 234.8 | 0.9 |
| 235 | 0.2 |
| 235.5 | 0.5 |
| 238 | 2.5 |
| 5711.9 |


 Homework Sourse