Please make this chart and fill it out with formulas thank y
Please make this chart and fill it out with formula\'s! thank you so much!
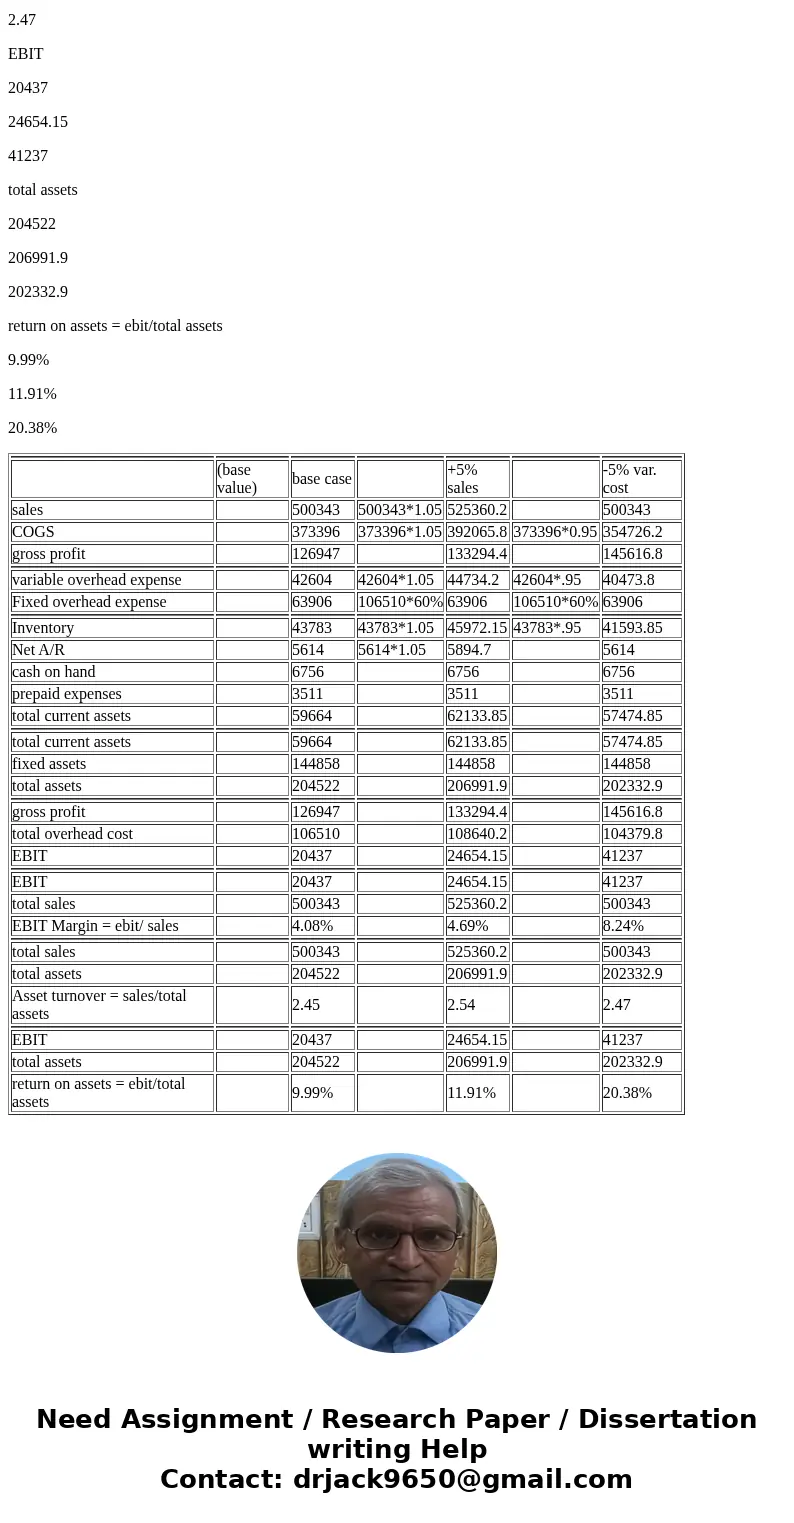
HOMEWORK PROBLEM Sales $500,343 Total Overhead Expenses-$106, 510 (40% Variable, 60% Fixed) Cost of Goods Sold $373,396 Inventory on Hand $43,783 Net Accounts Receivable $5,614 Cash-on-Hand $6,756 Fixed Assets $144,858 Prepaid Expenses $3,511 Note: All dollar figures are in millions. Create spreadsheet to calculate EBIT $, EBIT Margin %, Asset Turnover %, and Return on Assets 96. 1. If there is a 5% increase in sales, recalculate metrics. (remember, COGS and variable overhead expense increase correspondingly, and assume that Inventory and Net A/R increase correspondingly as we 2. If there is 5% decrease in cost (COGS + variable OH), recalculate metrics. Assume that COGS and Inventory decrease proportionally. 3.Solution
(base value)
base case
+5% sales
-5% var. cost
sales
500343
500343*1.05
525360.2
500343
COGS
373396
373396*1.05
392065.8
373396*0.95
354726.2
gross profit
126947
133294.4
145616.8
variable overhead expense
42604
42604*1.05
44734.2
42604*.95
40473.8
Fixed overhead expense
63906
106510*60%
63906
106510*60%
63906
Inventory
43783
43783*1.05
45972.15
43783*.95
41593.85
Net A/R
5614
5614*1.05
5894.7
5614
cash on hand
6756
6756
6756
prepaid expenses
3511
3511
3511
total current assets
59664
62133.85
57474.85
total current assets
59664
62133.85
57474.85
fixed assets
144858
144858
144858
total assets
204522
206991.9
202332.9
gross profit
126947
133294.4
145616.8
total overhead cost
106510
108640.2
104379.8
EBIT
20437
24654.15
41237
EBIT
20437
24654.15
41237
total sales
500343
525360.2
500343
EBIT Margin = ebit/ sales
4.08%
4.69%
8.24%
total sales
500343
525360.2
500343
total assets
204522
206991.9
202332.9
Asset turnover = sales/total assets
2.45
2.54
2.47
EBIT
20437
24654.15
41237
total assets
204522
206991.9
202332.9
return on assets = ebit/total assets
9.99%
11.91%
20.38%
| (base value) | base case | +5% sales | -5% var. cost | |||
| sales | 500343 | 500343*1.05 | 525360.2 | 500343 | ||
| COGS | 373396 | 373396*1.05 | 392065.8 | 373396*0.95 | 354726.2 | |
| gross profit | 126947 | 133294.4 | 145616.8 | |||
| variable overhead expense | 42604 | 42604*1.05 | 44734.2 | 42604*.95 | 40473.8 | |
| Fixed overhead expense | 63906 | 106510*60% | 63906 | 106510*60% | 63906 | |
| Inventory | 43783 | 43783*1.05 | 45972.15 | 43783*.95 | 41593.85 | |
| Net A/R | 5614 | 5614*1.05 | 5894.7 | 5614 | ||
| cash on hand | 6756 | 6756 | 6756 | |||
| prepaid expenses | 3511 | 3511 | 3511 | |||
| total current assets | 59664 | 62133.85 | 57474.85 | |||
| total current assets | 59664 | 62133.85 | 57474.85 | |||
| fixed assets | 144858 | 144858 | 144858 | |||
| total assets | 204522 | 206991.9 | 202332.9 | |||
| gross profit | 126947 | 133294.4 | 145616.8 | |||
| total overhead cost | 106510 | 108640.2 | 104379.8 | |||
| EBIT | 20437 | 24654.15 | 41237 | |||
| EBIT | 20437 | 24654.15 | 41237 | |||
| total sales | 500343 | 525360.2 | 500343 | |||
| EBIT Margin = ebit/ sales | 4.08% | 4.69% | 8.24% | |||
| total sales | 500343 | 525360.2 | 500343 | |||
| total assets | 204522 | 206991.9 | 202332.9 | |||
| Asset turnover = sales/total assets | 2.45 | 2.54 | 2.47 | |||
| EBIT | 20437 | 24654.15 | 41237 | |||
| total assets | 204522 | 206991.9 | 202332.9 | |||
| return on assets = ebit/total assets | 9.99% | 11.91% | 20.38% |
 Homework Sourse