Question l Ratio Analysis Confused Aussic Trading Limited a
Question l: Ratio Analysis Confused Aussic Trading Limited, a company listed on the Unintelligent Stock Exchange, is a trading and investment entity. The company trades exclusively in running equipment and invests in property and other firms You are considering investing into Confused Aussic Trading Limited. The company has provided you the financial statements (i.e, income statement and balance sheet) for 2022, 2023 and 2023 Sales Revenue Cost of Goods Sold Gross Profi $162,349,000.00 $75,937,000.00 586412.000.00 S151,765,000.00 $84,972,000.00 566,793,000.00 $181,546,000.00 S89,752,000.00 S91,794,000.00 Selling and Distribution Expenses Administrative Expenses Other Income Gain (Loss) on Sale of Land Gain (Loss) Sale of Equipment Impairment Loss Operating Profit S25,369,000.00 $10,538.000.00 $21,050,000.00 S12,861,000.00 S4,891,000.00 $7.200,000.00 $72,325,000.00 S31,598,000.00 $14,001,000.00 S15,605,000.00 S0.00 $15,489,000.00 S0.00 $21,310,000.00 S30,175,000.00 15,089,000.00 S10,578,000.00 S0.00 S0.00 $2,000,000.00 S55,108,000.00 Finance Income Finance Costs Finance Costs (Net) $2.453,000.00 $14,890,000.00 $12,437,000.00 $2.453,000.00 $14,890,000.00 $12,437,000.00 $4,505,000.00 S11,540.000.00 $7,035,000.00 Share of Net Gain (Loss) from Associates Share of Net Gain (Loss) from Joint Venture $4,287,000.00 $15,069,000.00 $4,287,000.00 $25,069,000.00 $12,542,000.00 $5,891,000.00 Profit Before Income Tax Income Tax Profit After Tax $12,276.500.00 S36,829.500.00 $49,106,000.00 $20,483,000.00 S0.00 $20,483,000.00 S54,724,000.00 $13.681,000.00 S41,043.000.00


Solution
Year
2023
Year
2024
1. average inventory= (opening inventory+closing inventory)/2
2. average account receivable= (opening account receivable+closing account receivable)/2
*total sales are considered for the ratio as credit sales are specifically provided.
3. average total assets=(opening assets+closing asssets)/2
4. Working capital=current assets-current liabilities
5. Five factor Dupont:
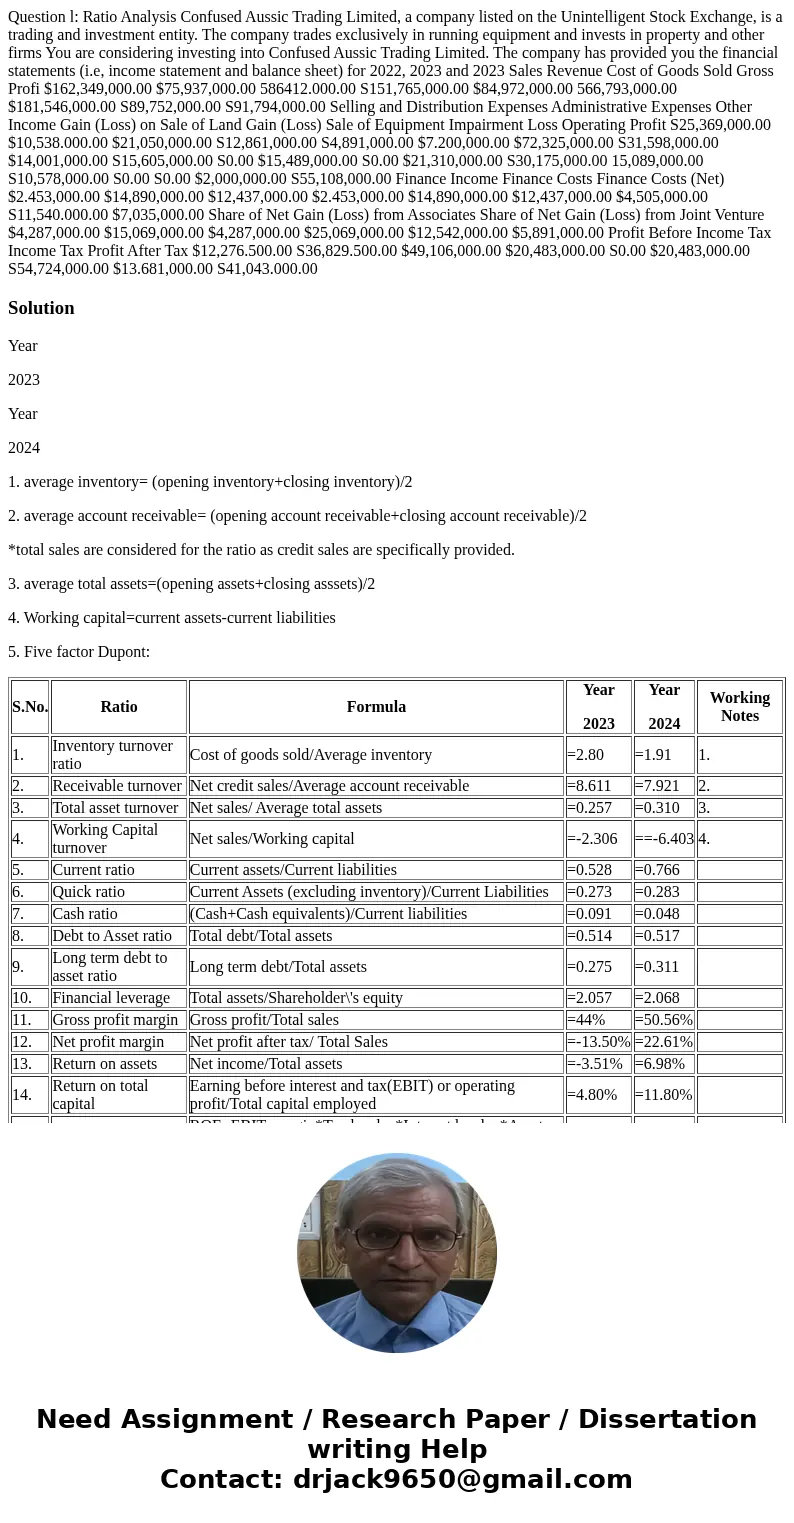
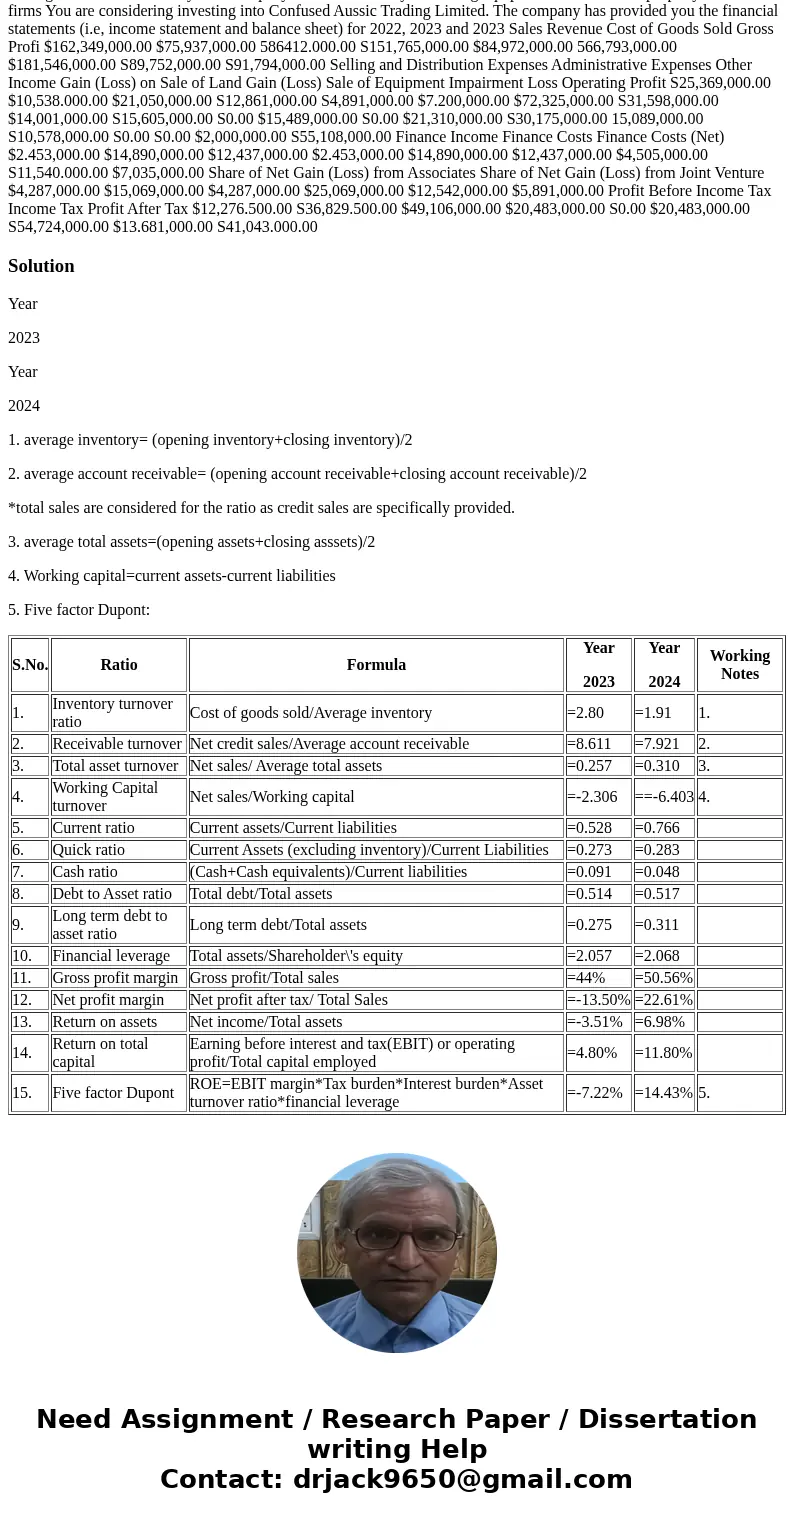
| S.No. | Ratio | Formula | Year 2023 | Year 2024 | Working Notes |
|---|---|---|---|---|---|
| 1. | Inventory turnover ratio | Cost of goods sold/Average inventory | =2.80 | =1.91 | 1. |
| 2. | Receivable turnover | Net credit sales/Average account receivable | =8.611 | =7.921 | 2. |
| 3. | Total asset turnover | Net sales/ Average total assets | =0.257 | =0.310 | 3. |
| 4. | Working Capital turnover | Net sales/Working capital | =-2.306 | ==-6.403 | 4. |
| 5. | Current ratio | Current assets/Current liabilities | =0.528 | =0.766 | |
| 6. | Quick ratio | Current Assets (excluding inventory)/Current Liabilities | =0.273 | =0.283 | |
| 7. | Cash ratio | (Cash+Cash equivalents)/Current liabilities | =0.091 | =0.048 | |
| 8. | Debt to Asset ratio | Total debt/Total assets | =0.514 | =0.517 | |
| 9. | Long term debt to asset ratio | Long term debt/Total assets | =0.275 | =0.311 | |
| 10. | Financial leverage | Total assets/Shareholder\'s equity | =2.057 | =2.068 | |
| 11. | Gross profit margin | Gross profit/Total sales | =44% | =50.56% | |
| 12. | Net profit margin | Net profit after tax/ Total Sales | =-13.50% | =22.61% | |
| 13. | Return on assets | Net income/Total assets | =-3.51% | =6.98% | |
| 14. | Return on total capital | Earning before interest and tax(EBIT) or operating profit/Total capital employed | =4.80% | =11.80% | |
| 15. | Five factor Dupont | ROE=EBIT margin*Tax burden*Interest burden*Asset turnover ratio*financial leverage | =-7.22% | =14.43% | 5. |


 Homework Sourse