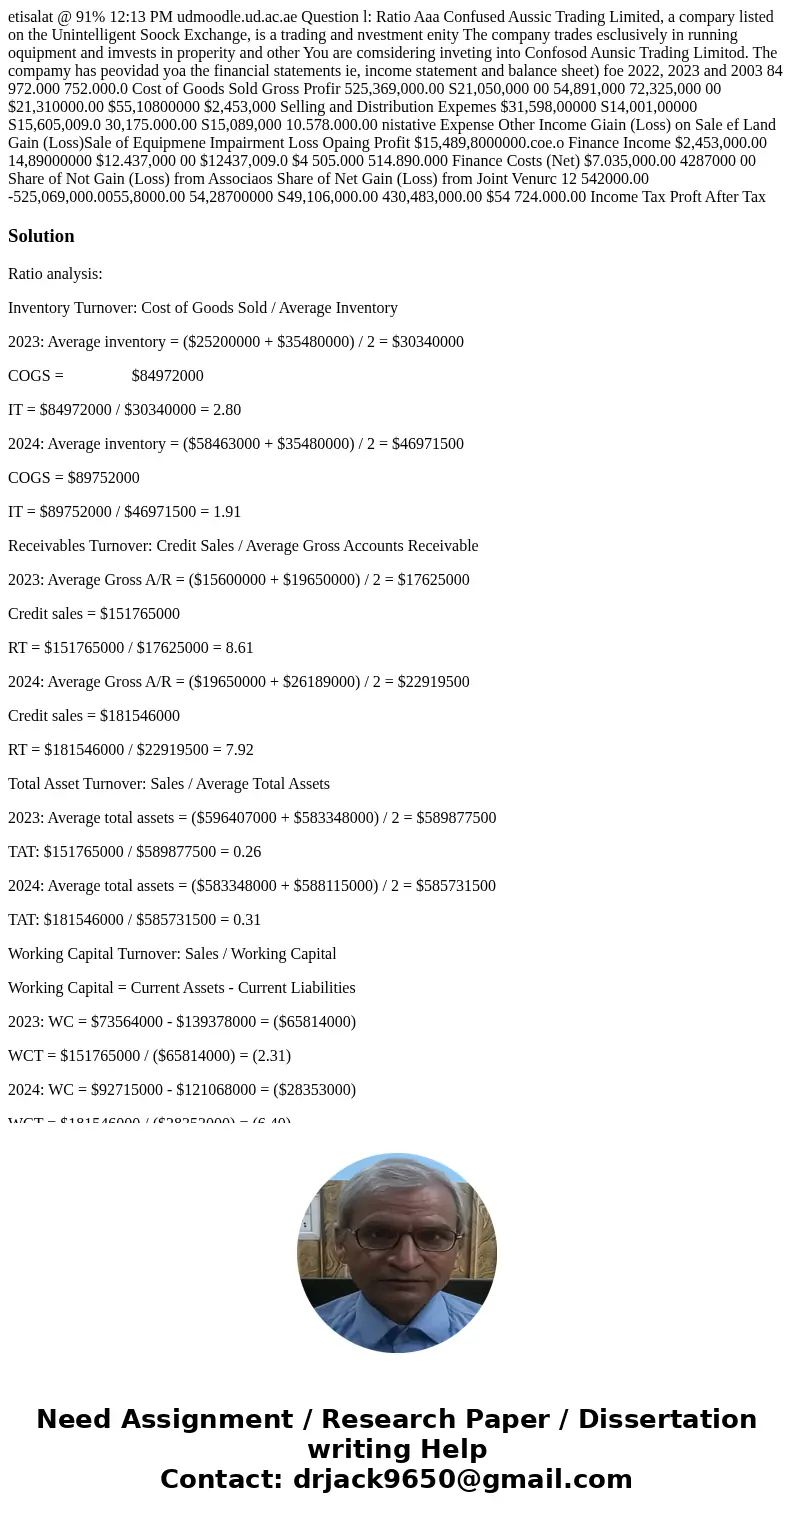
etisalat 91 1213 PM udmoodleudacae Question l Ratio Aaa Con
Solution
Ratio analysis:
Inventory Turnover: Cost of Goods Sold / Average Inventory
2023: Average inventory = ($25200000 + $35480000) / 2 = $30340000
COGS = $84972000
IT = $84972000 / $30340000 = 2.80
2024: Average inventory = ($58463000 + $35480000) / 2 = $46971500
COGS = $89752000
IT = $89752000 / $46971500 = 1.91
Receivables Turnover: Credit Sales / Average Gross Accounts Receivable
2023: Average Gross A/R = ($15600000 + $19650000) / 2 = $17625000
Credit sales = $151765000
RT = $151765000 / $17625000 = 8.61
2024: Average Gross A/R = ($19650000 + $26189000) / 2 = $22919500
Credit sales = $181546000
RT = $181546000 / $22919500 = 7.92
Total Asset Turnover: Sales / Average Total Assets
2023: Average total assets = ($596407000 + $583348000) / 2 = $589877500
TAT: $151765000 / $589877500 = 0.26
2024: Average total assets = ($583348000 + $588115000) / 2 = $585731500
TAT: $181546000 / $585731500 = 0.31
Working Capital Turnover: Sales / Working Capital
Working Capital = Current Assets - Current Liabilities
2023: WC = $73564000 - $139378000 = ($65814000)
WCT = $151765000 / ($65814000) = (2.31)
2024: WC = $92715000 - $121068000 = ($28353000)
WCT = $181546000 / ($28353000) = (6.40)
Current Ratio: Current Assets / Current Liabilities
2023: $73564000 / $139378000 = 0.53
2024: $92715000 / $121068000 = 0.77
Quick Ratio: Quick assets / Current Liabilities
2023: Quick assets = $73564000 – ($35480000 + $1250000) = $36834000
QR = $36834000 / $139378000 = 0.26
2024: Quick assets = $92715000 – ($58463000 + $750000) = $33502000
QR = $33502000 / $121068000 = 0.28
Cash Ratio: Cash + Marketable securities / Current liabilities
2023: ($12684000 + $4500000) / $139378000 = 0.12
2024: ($5813000 + $1500000) / $121068000 = 0.06
Debt to Assets ratio: Total Debt / Total Assets
2023: $299801000 / $583348000 = 0.51
2024: $303775000 / $588115000 = 0.52
Long-term Debt to Asset Ratio: Total long term debt / Total Assets
2023: $160423000 / $583348000 = 0.28
2024: $182707000 / $588115000 = 0.31
Financial leverage: Assets / Equity
2023: $583348000 / $283547000 = 2.06
2024: $588115000 / $284340000 = 2.07
Gross profit margin: GP / Sales
2023: $66793000 / $151765000 = 44%
2024: $91794000 / $181546000 = 51%
Net profit margin: NP / Sales
2023: -$20483000 / $151765000 = -13.5%
2024: $41043000 / $181546000 = 22.60%
Return on Assets: Net Income / Average Total Assets
2023: Average total Assets = ($596407000 + $583348000) / 2 = $589877500
ROA = -$20483000 / $589877500 = -0.03 or -3%
2024: Average total Assets = ($583348000 + $588115000) / 2 = $585731500
ROA = $41043000 / $585731500 = 0.07 or 7%
Return on Total Capital: Net Income / (Shareholder’s equity + Non-current liabilities)
2023: -$20483000 / ($283547000 + $160423000) = -4.61%
2024: $41043000 / ($284340000 + $182707000) = 8.78%
Five factor DuPont Model for ROE:
ROE = Net Profit / Pretax profit X Pretax profit / EBIT X EBIT / Sales X Sales / Assets X Assets / Equity
2023: -$20483000 / -$20483000 X -$20483000 / $21310000 X $21310000 / $151765000 X $151765000 / $583348000 X $583348000 / $283547000 = -0.07 OR -7%
2024: $41043000 / $54724000 X $54724000 / $55108000 X $55108000 / $181546000 X $181546000 / $588115000 X $588115000 / $284340000 = 0.14 OR 14%
Activity/Efficiency ratio:
Inventory turnover ratio for the market and the industry are higher than that of the organization. It means that the company is not efficient at selling its product in due course of time or high inventory stacked up over time thereby inefficiency in making the sale.
Accounts receivables turnover ratio for the industry and the market are higher than the company but the company is very close to that standard. The company is able to collect its receivables in time thereby ensuring efficient handling and management of receivables.
Liquidity ratio:
Quick ratio, current ratio and cash ratio all these are comparatively higher in the industry and the market than for the company. The company fails to manage its liquidity and hence proven to be facing some serious cash crunch both in present and in future as well.


 Homework Sourse