The table below shows the quarterly demand for a seasonal pr
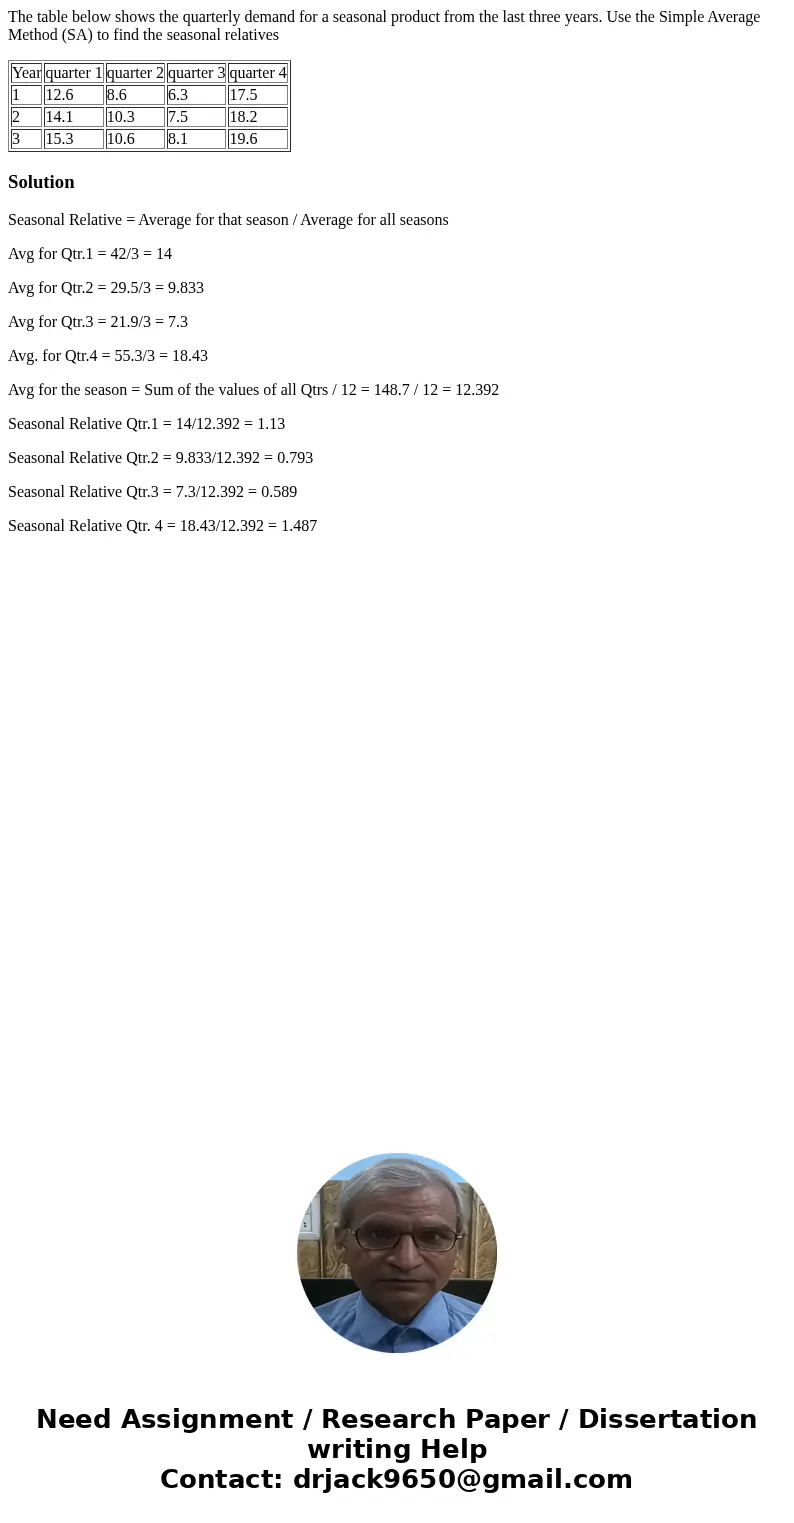
The table below shows the quarterly demand for a seasonal product from the last three years. Use the Simple Average Method (SA) to find the seasonal relatives
| Year | quarter 1 | quarter 2 | quarter 3 | quarter 4 |
| 1 | 12.6 | 8.6 | 6.3 | 17.5 |
| 2 | 14.1 | 10.3 | 7.5 | 18.2 |
| 3 | 15.3 | 10.6 | 8.1 | 19.6 |
Solution
Seasonal Relative = Average for that season / Average for all seasons
Avg for Qtr.1 = 42/3 = 14
Avg for Qtr.2 = 29.5/3 = 9.833
Avg for Qtr.3 = 21.9/3 = 7.3
Avg. for Qtr.4 = 55.3/3 = 18.43
Avg for the season = Sum of the values of all Qtrs / 12 = 148.7 / 12 = 12.392
Seasonal Relative Qtr.1 = 14/12.392 = 1.13
Seasonal Relative Qtr.2 = 9.833/12.392 = 0.793
Seasonal Relative Qtr.3 = 7.3/12.392 = 0.589
Seasonal Relative Qtr. 4 = 18.43/12.392 = 1.487

 Homework Sourse