Files to Use httpwwwcsemsueducse231ProjectsProject05RedCedar
Files to Use
http://www.cse.msu.edu/~cse231/Projects/Project05/RedCedarRiver.txt
http://www.cse.msu.edu/~cse231/Projects/Project05/plot.py
Assignment Overview
This assignment focuses on the implementation of Python programs to read files and process data by using lists and functions.
Assignment Background
U.S. Geological Survey (USGS) provides scientific information to understand Earth, manage resources and minimize loss from natural disasters. You can download interesting data from the website https://www.usgs.gov/
We have downloaded the flow rate data for the Red Cedar River in East Lansing starting from 1932 . Your task is to design and implement a Python program that draws two plots from the data (and displays a table of data for each plot).
Here is the first line of the file. The numbers that we are interested are the last three numbers which are year, month and flow rate in cubic feet per second (CFS). Notice that the year and month are ints and the flow rate is float:
Assignment Specifications
1. The program must provide following functions to extract some statistics.
a) open_file()prompts the user to enter a file name. The program will try to open the data
file. Appropriate error message should be shown if the data file cannot be opened. This function will loop until it receives proper input and successfully opens the file. It returns a file pointer.
b) read_file()calls the open_file() function and uses the returned file pointer to read the data file. This function returns a list of your choosing containing data you need for other parts of this project.
c) draw_plot( x, y, plt_title, x_label, y_label) provided by us takes two equal-length lists of numbers and plots them. You need to pass the label strings and plot title
to the function. Include the range of years in the title (Hint: use string concatenation and check sample output).
d) annual_average(L) takes a list as an argument and returns a list of tuples in the form (year, average_flow).
e) month_average(L) takes a list as an argument and returns a list of tuples in the form (year, month_flow).
f) You may use extra functions, if you wish.
2. The program should read the file only once.
3. The program should plot the average flow for each year. That is, find the average flow for each year and then generate a plot with years on the x-axis and average flow for that year on the y-axis. Then generate a table that has the year and average flow on each line. Put a title on the table and label each column.
4. Next, the program should prompt the user for a number in the range 1-12 and should plot the flow rates for only that month. For example if user enters 1, the program should extract the flow rate of Jan 1932, Jan 1933, ... , Jan 2015 and plot them. (Note: do not loop and ask for more.)
5. The program should re-prompt the user if an invalid input (either wrong type or wrong value), was entered for the month. If something other than an integer is input, your error message should include the phrase “not an integer.” If an integer is input but it is not in the proper range, your error message should include the phrase “integer out of range.” Note: use exceptions.
6. The month name should be displayed in the title of the second plot instead of the month number. For example, in the sample below you see “May” in the title. (Hint: use the month number as an index into a list of strings.) As with the previous plot, display a table of values that you plotted.
Assignment Notes
1. Note that data are separated using spaces. You can use the list method .split() to split the line into a list of data.
2. It is much easier to convert the input data to int and float when the program reads the file and creates the list.
3. To create a list L of data begin with an empty list (e.g. L = [] before the loop begins) and within the loop append to the list one item at a time, e.g. L.append(item). The data item you append may be a collection such as a tuple or another list.
Sample Output
1932 192.10
1933 175.87
1934 68.55
1935 133.70
1936 107.92
1937 210.64
1938 203.00
1939 130.68
1940 155.16
1941 111.76
1942 222.91
1943 322.06
1944 168.40
1945 222.66
1946 132.44
1947 371.00
1948 332.60
1949 206.60
1950 345.97
1951 255.01
1952 216.94
1953 135.51
1954 237.37
1955 142.05
1956 288.82
1957 228.67
1958 102.73
1959 309.37
1960 221.05
1961 125.65
1962 146.39
1963 97.81
1964 48.00
1965 173.39
1966 155.56
1967 215.01
1968 290.97
1969 219.15
1970 198.05
1971 183.03
1972 231.14
1973 284.19
1974 297.25
1975 358.62
1976 281.77
1977 131.30
1978 143.01
1979 157.99
1980 213.15
1981 265.15
1982 246.95
1983 247.17
1984 171.79
1985 339.39
1986 307.77
1987 139.50
1988 191.94
1989 229.23
1990 282.57
1991 211.63
1992 351.48
1993 347.92
1994 397.64
1995 202.06
1996 194.83
1997 242.16
1998 247.35
1999 134.24
2000 174.79
2001 326.02
2002 179.25
2003 135.74
2004 239.83
2005 167.75
2006 271.75
2007 227.99
2008 332.66
2009 377.72
2010 189.64
2011 353.33
2012 145.84
2013 247.27
2014 264.20
2015 191.46
1932 362.40
1933 354.50
1934 65.40
1935 190.00
1936 103.60
1937 376.30
1938 214.60
1939 100.40
1940 94.50
1941 99.90
1942 99.30
1943 1008.00
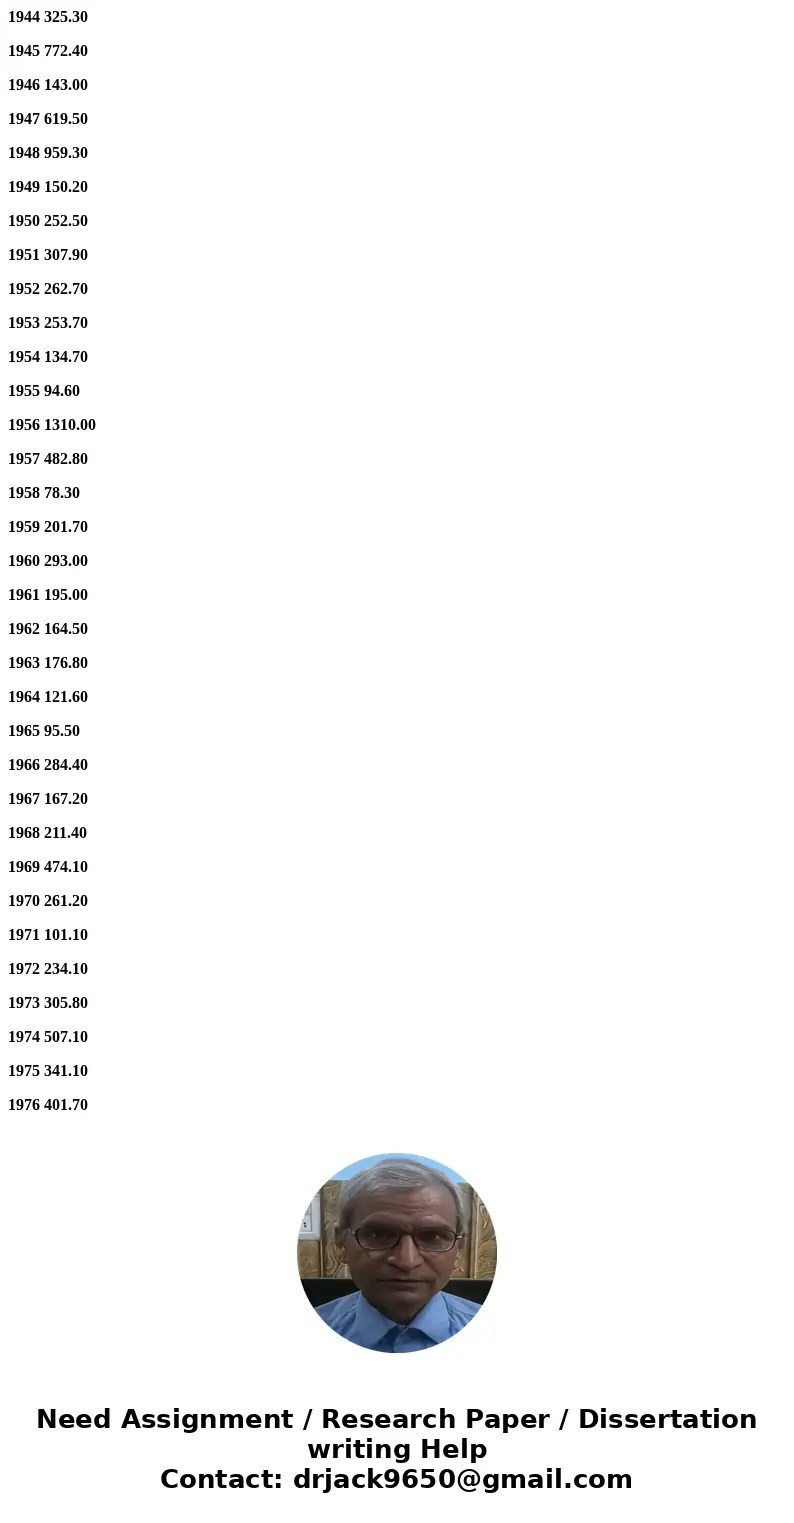
1944 325.30
1945 772.40
1946 143.00
1947 619.50
1948 959.30
1949 150.20
1950 252.50
1951 307.90
1952 262.70
1953 253.70
1954 134.70
1955 94.60
1956 1310.00
1957 482.80
1958 78.30
1959 201.70
1960 293.00
1961 195.00
1962 164.50
1963 176.80
1964 121.60
1965 95.50
1966 284.40
1967 167.20
1968 211.40
1969 474.10
1970 261.20
1971 101.10
1972 234.10
1973 305.80
1974 507.10
1975 341.10
1976 401.70
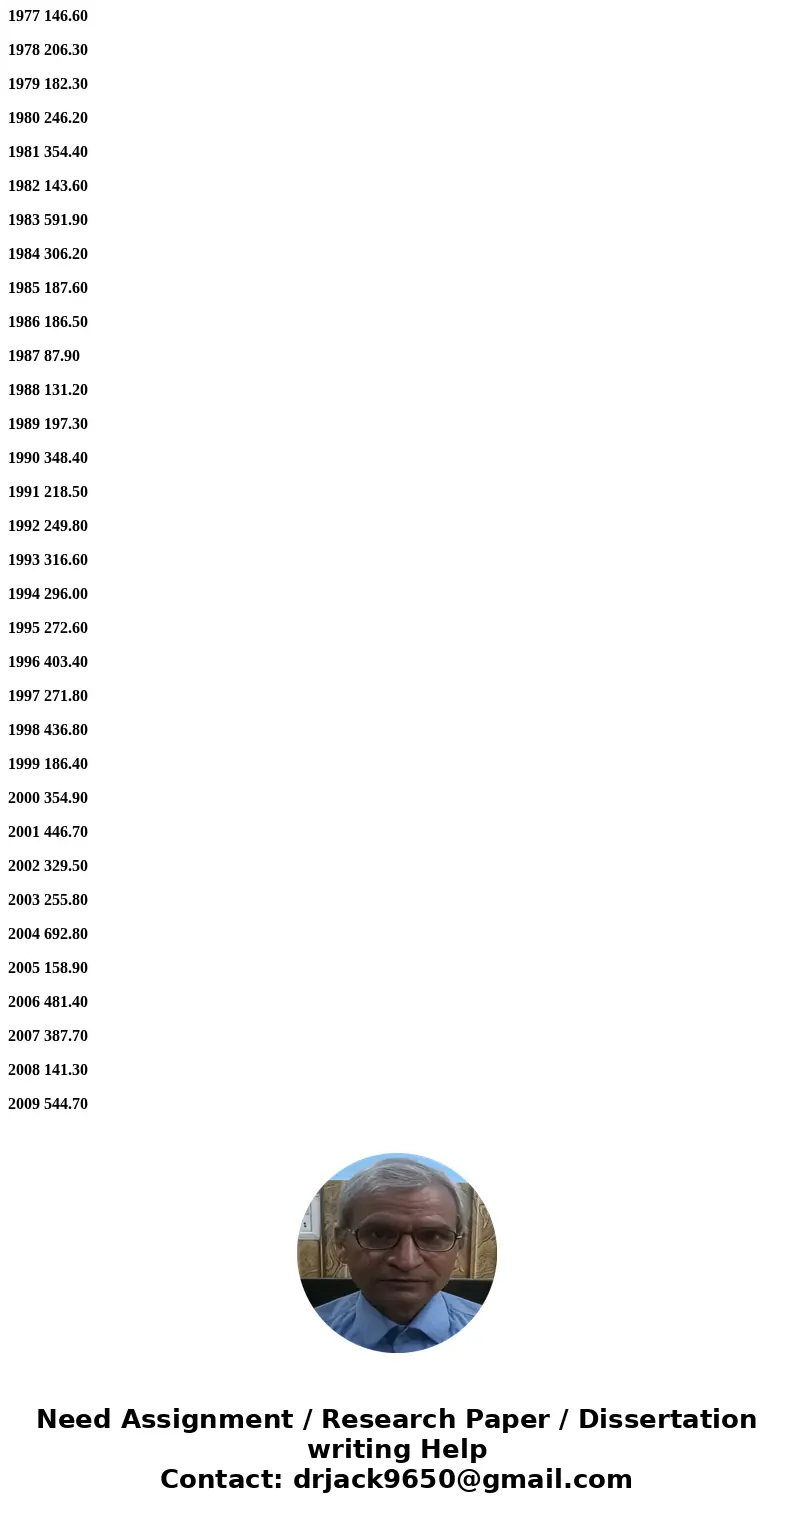
1977 146.60
1978 206.30
1979 182.30
1980 246.20
1981 354.40
1982 143.60
1983 591.90
1984 306.20
1985 187.60
1986 186.50
1987 87.90
1988 131.20
1989 197.30
1990 348.40
1991 218.50
1992 249.80
1993 316.60
1994 296.00
1995 272.60
1996 403.40
1997 271.80
1998 436.80
1999 186.40
2000 354.90
2001 446.70
2002 329.50
2003 255.80
2004 692.80
2005 158.90
2006 481.40
2007 387.70
2008 141.30
2009 544.70
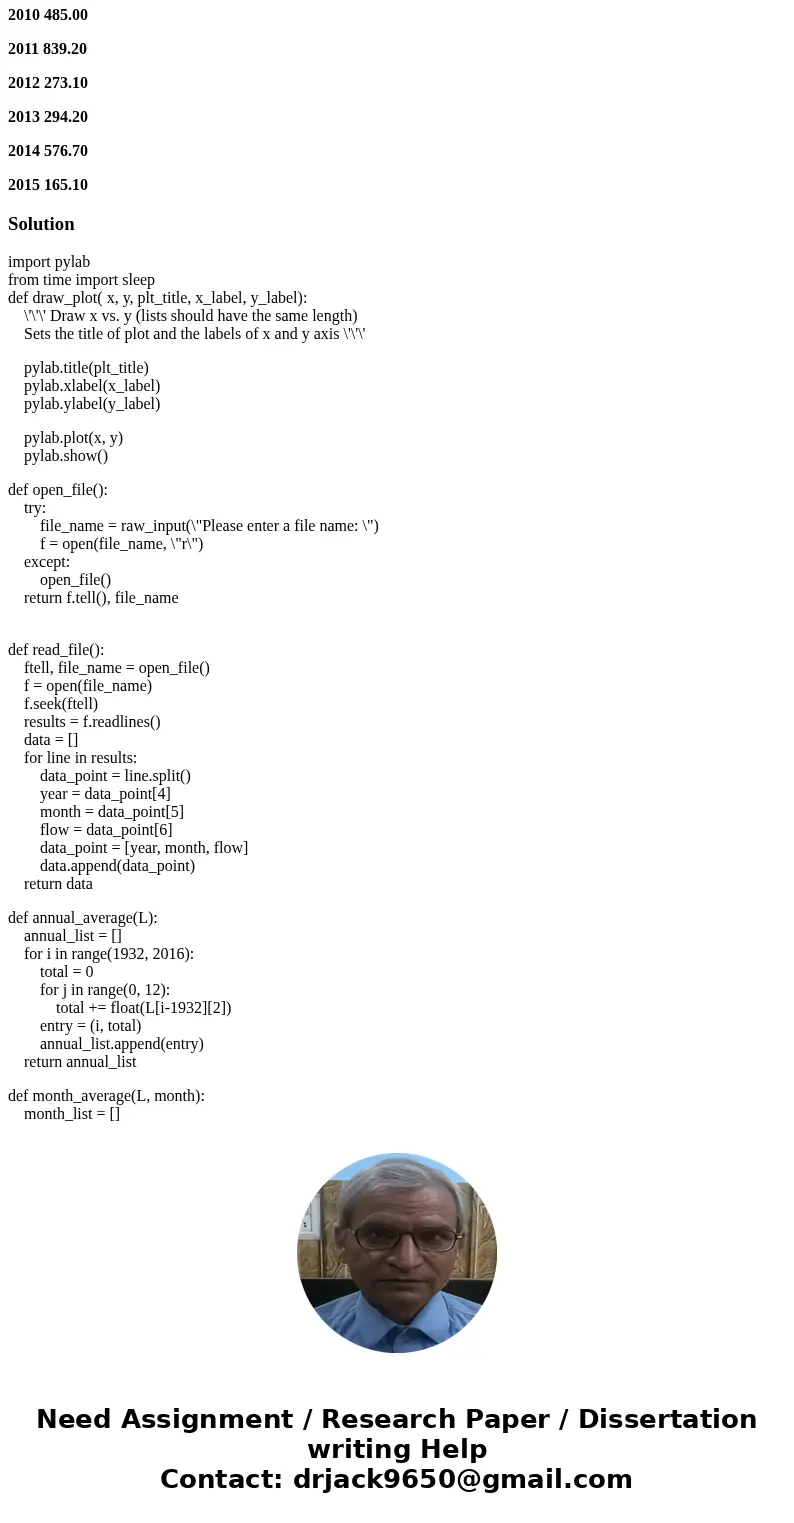
2010 485.00
2011 839.20
2012 273.10
2013 294.20
2014 576.70
2015 165.10
Solution
import pylab
from time import sleep
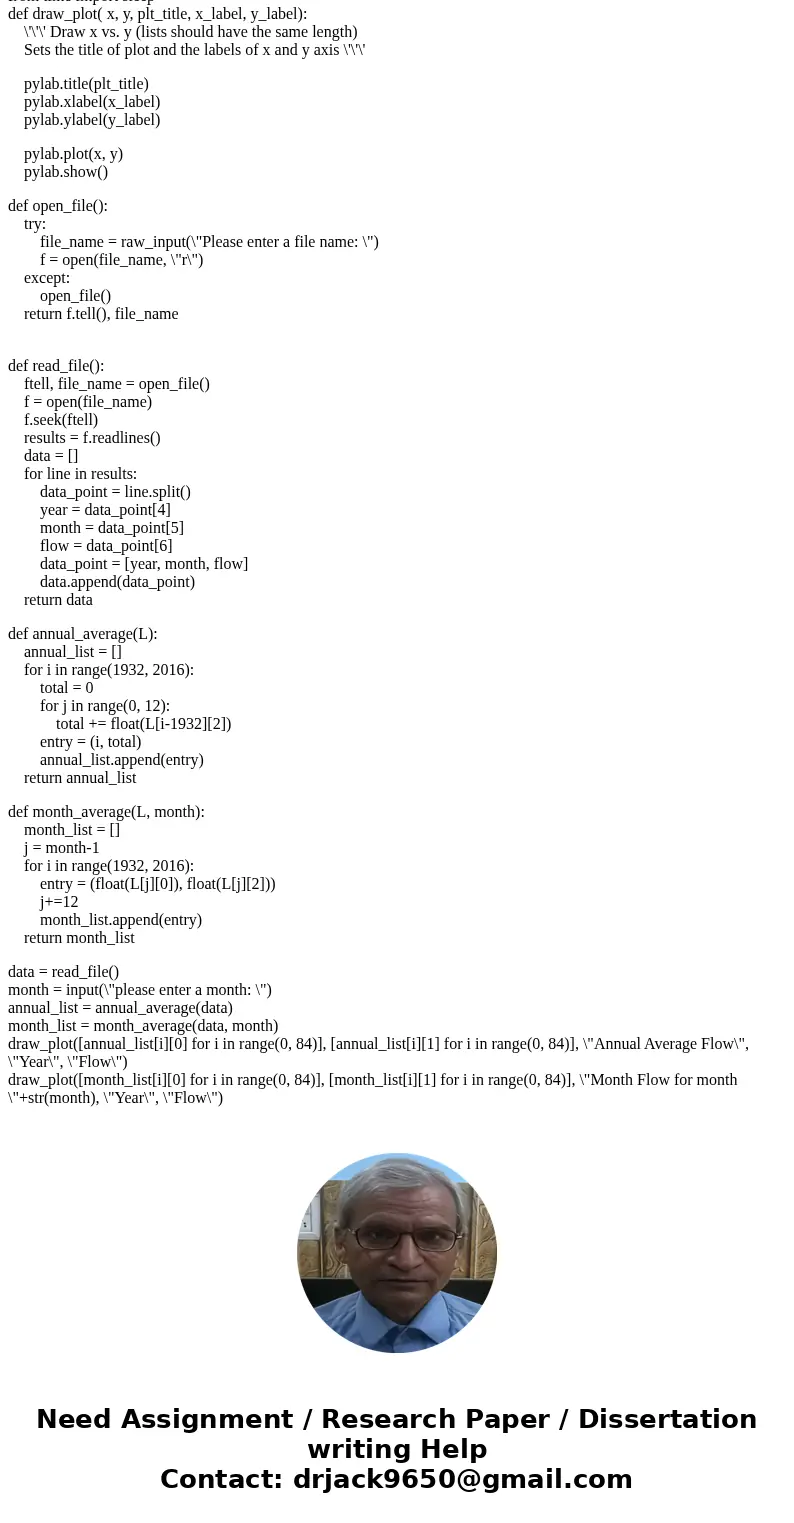
def draw_plot( x, y, plt_title, x_label, y_label):
\'\'\' Draw x vs. y (lists should have the same length)
Sets the title of plot and the labels of x and y axis \'\'\'
pylab.title(plt_title)
pylab.xlabel(x_label)
pylab.ylabel(y_label)
pylab.plot(x, y)
pylab.show()
def open_file():
try:
file_name = raw_input(\"Please enter a file name: \")
f = open(file_name, \"r\")
except:
open_file()
return f.tell(), file_name
def read_file():
ftell, file_name = open_file()
f = open(file_name)
f.seek(ftell)
results = f.readlines()
data = []
for line in results:
data_point = line.split()
year = data_point[4]
month = data_point[5]
flow = data_point[6]
data_point = [year, month, flow]
data.append(data_point)
return data
def annual_average(L):
annual_list = []
for i in range(1932, 2016):
total = 0
for j in range(0, 12):
total += float(L[i-1932][2])
entry = (i, total)
annual_list.append(entry)
return annual_list
def month_average(L, month):
month_list = []
j = month-1
for i in range(1932, 2016):
entry = (float(L[j][0]), float(L[j][2]))
j+=12
month_list.append(entry)
return month_list
data = read_file()
month = input(\"please enter a month: \")
annual_list = annual_average(data)
month_list = month_average(data, month)
draw_plot([annual_list[i][0] for i in range(0, 84)], [annual_list[i][1] for i in range(0, 84)], \"Annual Average Flow\", \"Year\", \"Flow\")
draw_plot([month_list[i][0] for i in range(0, 84)], [month_list[i][1] for i in range(0, 84)], \"Month Flow for month \"+str(month), \"Year\", \"Flow\")
 Homework Sourse