A random sample of n116 communities in western Kansas gave t
A random sample of n1=16 communities in western Kansas gave the following information for people under 25 years of age.
x1: rate of hay fever per 1,000 population for people under 25
121 110 90 82 124 112 102 91 122 112 114 108 112 81 122 142
A random sample of n2=14 regions in western kansas gave the following information for people over 50 years old.
x2: rate of hay fever per 1,000 population for people over 50
110 88 126 87 112 73 100 94 92 100 102 102 89 90
Assume that the hay fever rate in each age group has an approximately normal distribution. Do the data indicate that the age group over 50 has a lower rate of hay fever? Use =0.05. What is the value of the test statistic?
A. 0.550
B. -1.519
C. -0.550
D. -2.141
E. 2.141
Solution
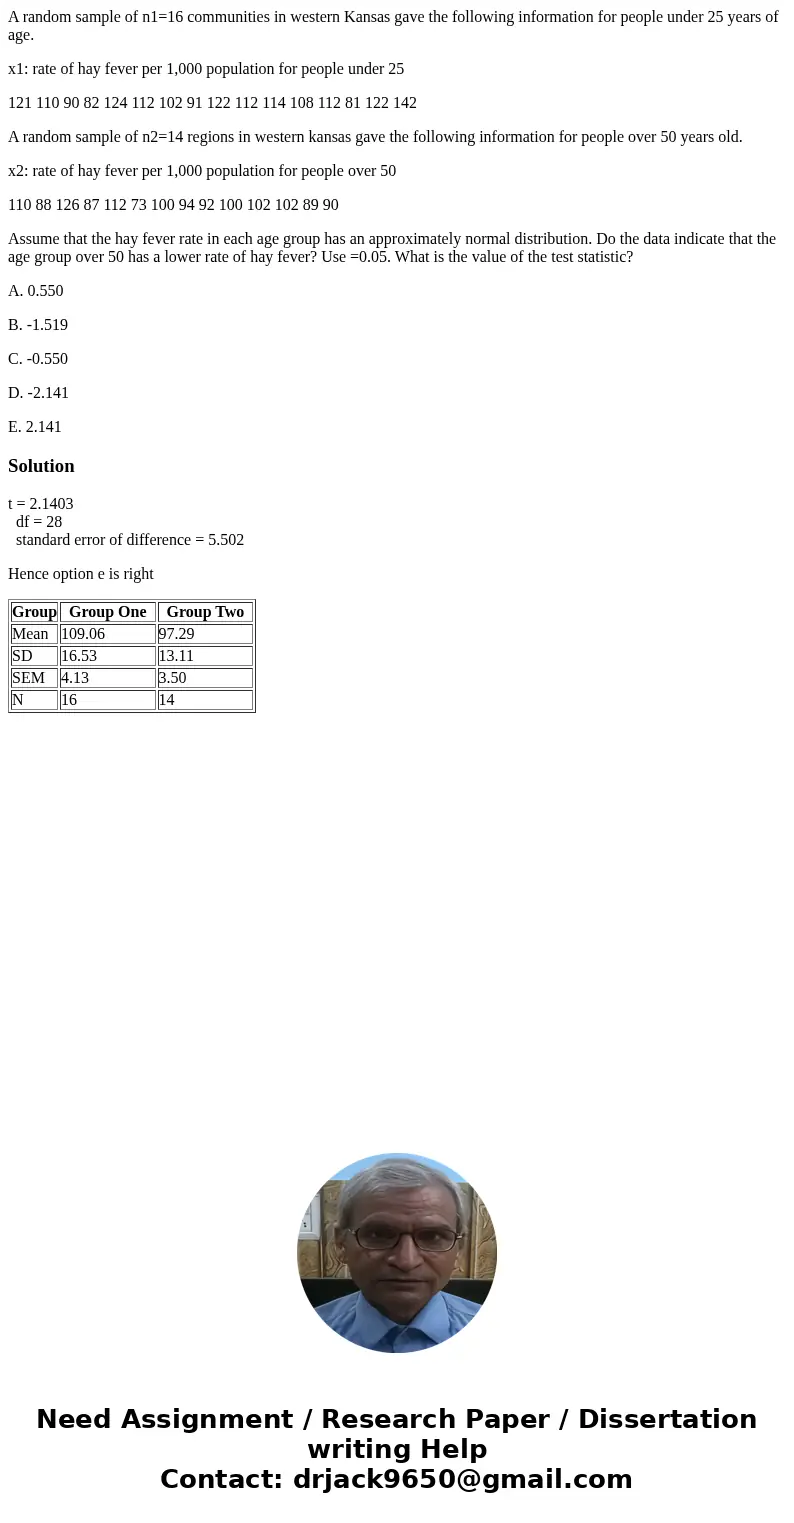
t = 2.1403
df = 28
standard error of difference = 5.502
Hence option e is right
| Group | Group One | Group Two |
|---|---|---|
| Mean | 109.06 | 97.29 |
| SD | 16.53 | 13.11 |
| SEM | 4.13 | 3.50 |
| N | 16 | 14 |

 Homework Sourse