The following data show the number of hours studied for an e
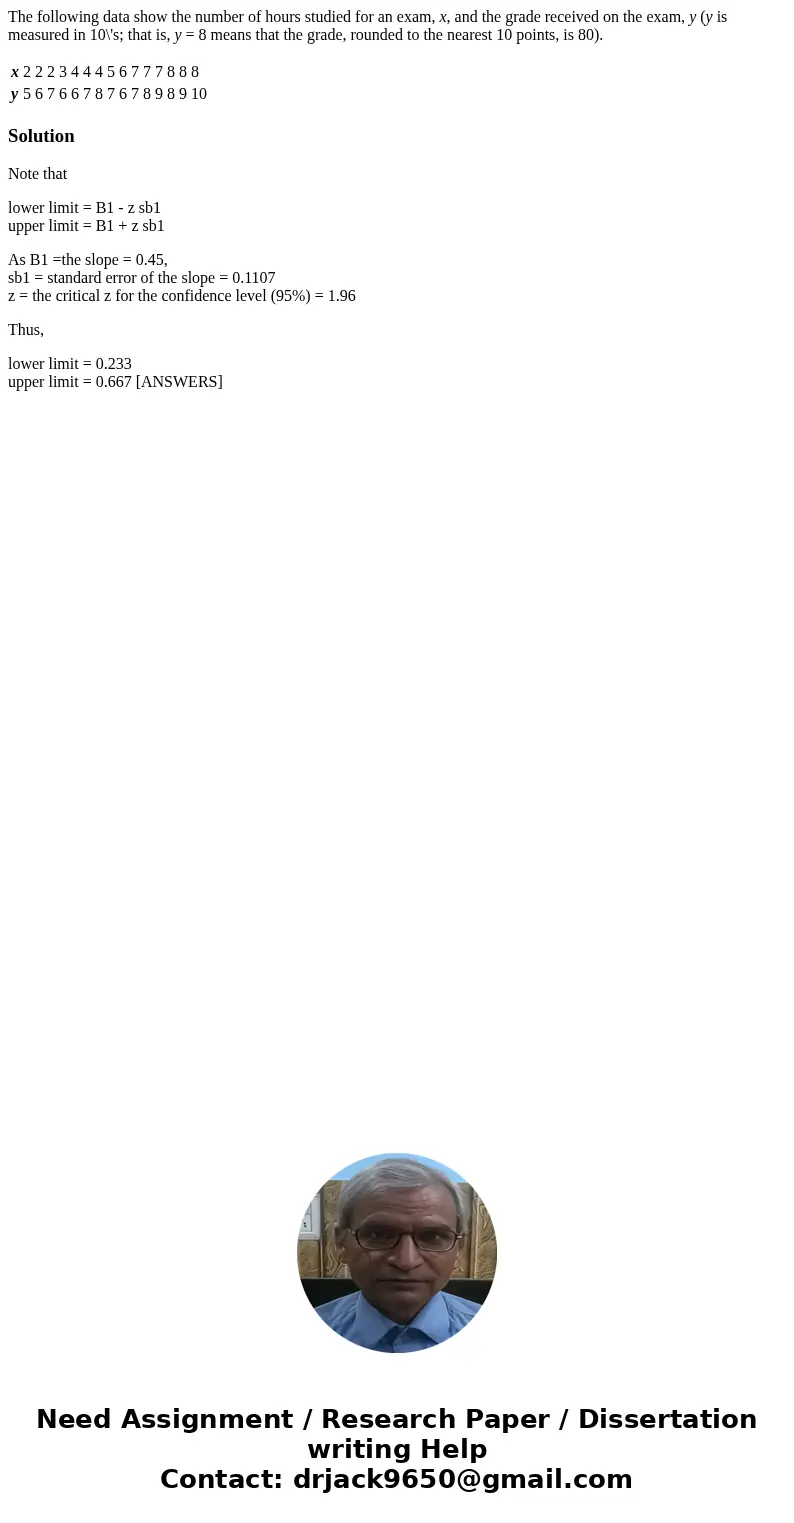
The following data show the number of hours studied for an exam, x, and the grade received on the exam, y (y is measured in 10\'s; that is, y = 8 means that the grade, rounded to the nearest 10 points, is 80).
| x | 2 | 2 | 2 | 3 | 4 | 4 | 4 | 5 | 6 | 7 | 7 | 7 | 8 | 8 | 8 |
|---|---|---|---|---|---|---|---|---|---|---|---|---|---|---|---|
| y | 5 | 6 | 7 | 6 | 6 | 7 | 8 | 7 | 6 | 7 | 8 | 9 | 8 | 9 | 10 |
Solution
Note that
lower limit = B1 - z sb1
upper limit = B1 + z sb1
As B1 =the slope = 0.45,
sb1 = standard error of the slope = 0.1107
z = the critical z for the confidence level (95%) = 1.96
Thus,
lower limit = 0.233
upper limit = 0.667 [ANSWERS]

 Homework Sourse