9 A study of commuting times reports the travel times to wor
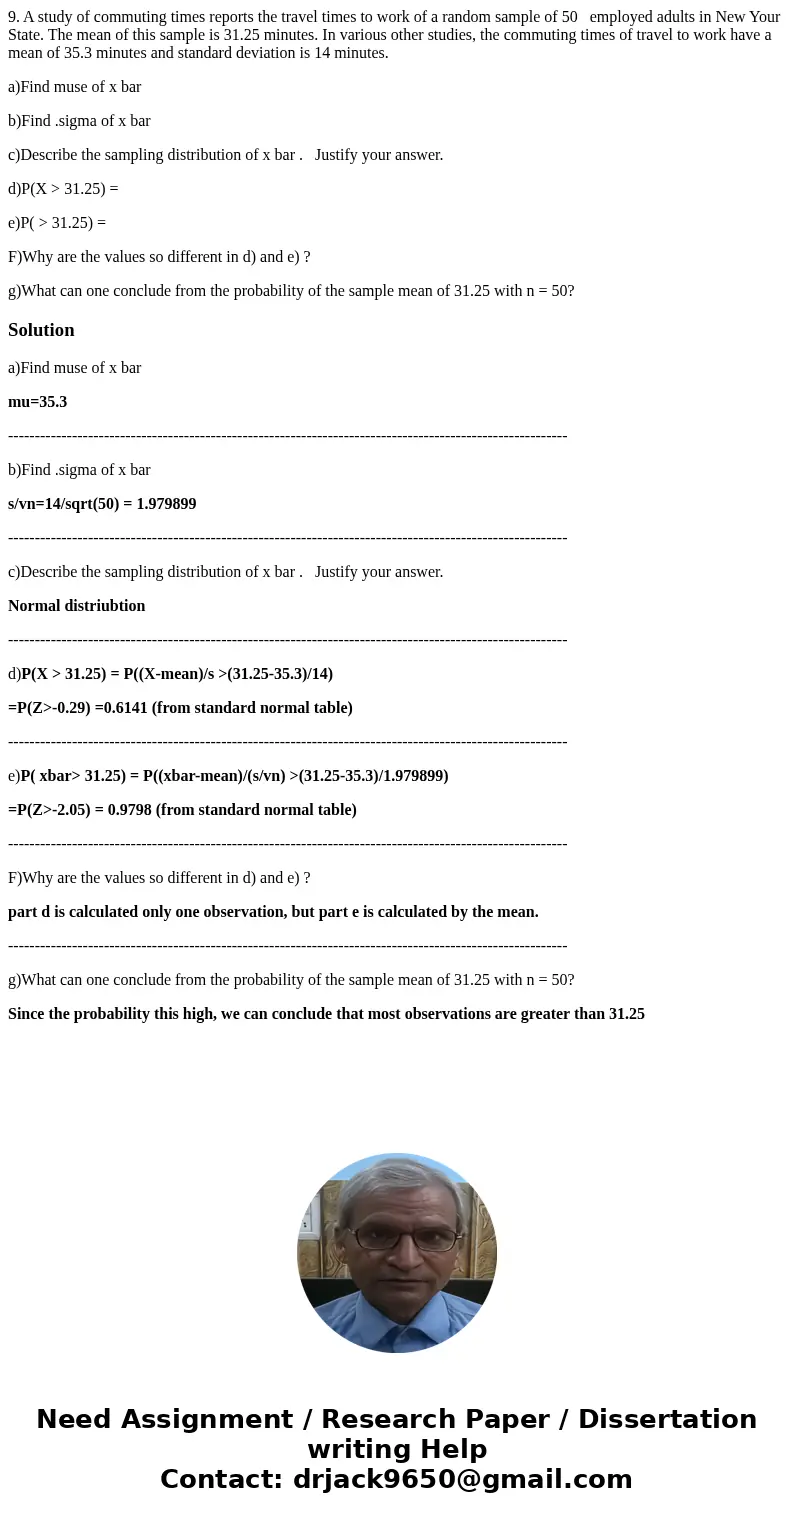
9. A study of commuting times reports the travel times to work of a random sample of 50 employed adults in New Your State. The mean of this sample is 31.25 minutes. In various other studies, the commuting times of travel to work have a mean of 35.3 minutes and standard deviation is 14 minutes.
a)Find muse of x bar
b)Find .sigma of x bar
c)Describe the sampling distribution of x bar . Justify your answer.
d)P(X > 31.25) =
e)P( > 31.25) =
F)Why are the values so different in d) and e) ?
g)What can one conclude from the probability of the sample mean of 31.25 with n = 50?
Solution
a)Find muse of x bar
mu=35.3
---------------------------------------------------------------------------------------------------------
b)Find .sigma of x bar
s/vn=14/sqrt(50) = 1.979899
---------------------------------------------------------------------------------------------------------
c)Describe the sampling distribution of x bar . Justify your answer.
Normal distriubtion
---------------------------------------------------------------------------------------------------------
d)P(X > 31.25) = P((X-mean)/s >(31.25-35.3)/14)
=P(Z>-0.29) =0.6141 (from standard normal table)
---------------------------------------------------------------------------------------------------------
e)P( xbar> 31.25) = P((xbar-mean)/(s/vn) >(31.25-35.3)/1.979899)
=P(Z>-2.05) = 0.9798 (from standard normal table)
---------------------------------------------------------------------------------------------------------
F)Why are the values so different in d) and e) ?
part d is calculated only one observation, but part e is calculated by the mean.
---------------------------------------------------------------------------------------------------------
g)What can one conclude from the probability of the sample mean of 31.25 with n = 50?
Since the probability this high, we can conclude that most observations are greater than 31.25

 Homework Sourse