Can someone interpret this chart of regression Question Use
Can someone interpret this chart of regression?
Question:
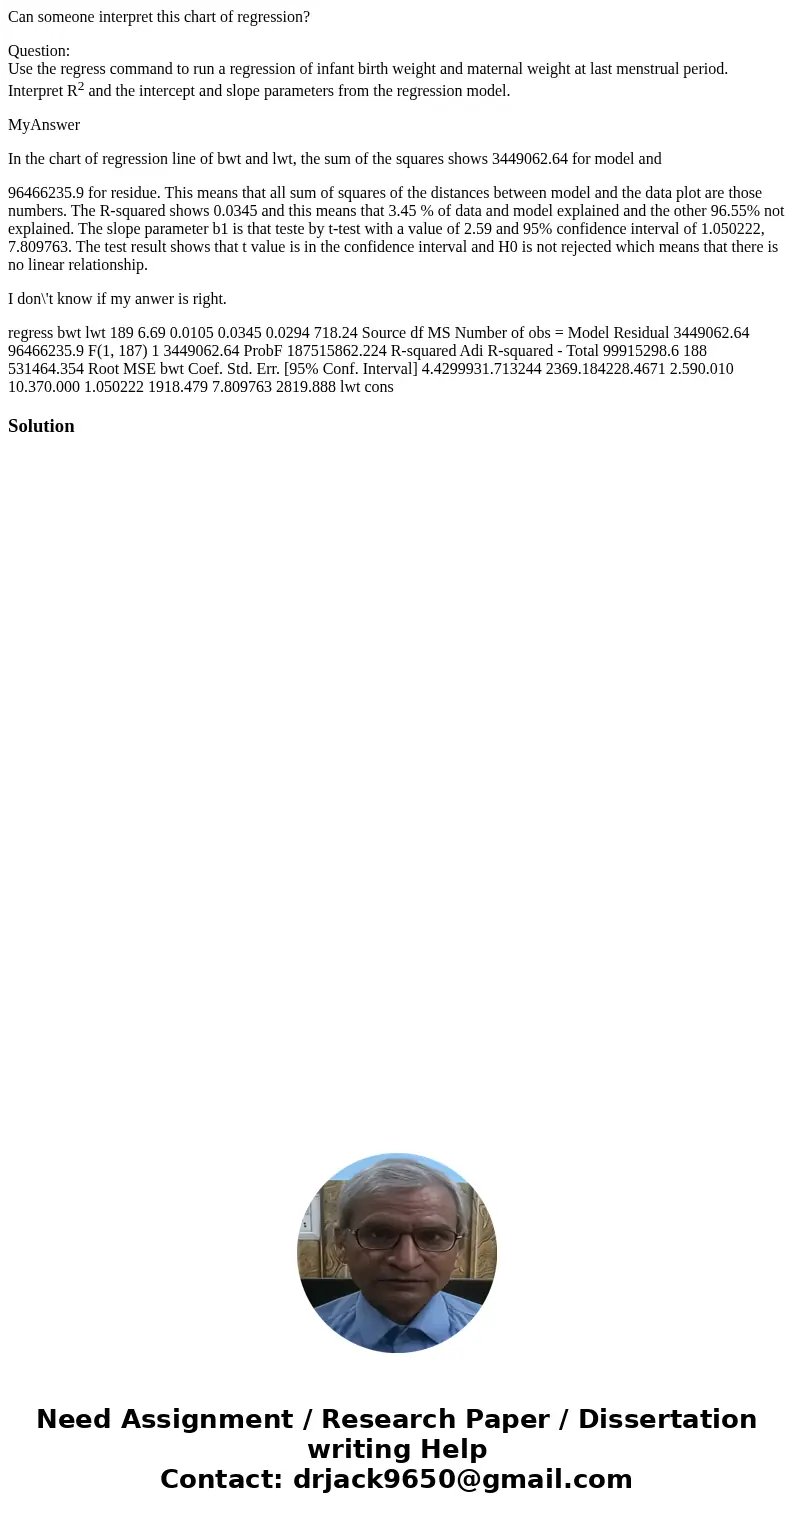
Use the regress command to run a regression of infant birth weight and maternal weight at last menstrual period. Interpret R2 and the intercept and slope parameters from the regression model.
MyAnswer
In the chart of regression line of bwt and lwt, the sum of the squares shows 3449062.64 for model and
96466235.9 for residue. This means that all sum of squares of the distances between model and the data plot are those numbers. The R-squared shows 0.0345 and this means that 3.45 % of data and model explained and the other 96.55% not explained. The slope parameter b1 is that teste by t-test with a value of 2.59 and 95% confidence interval of 1.050222, 7.809763. The test result shows that t value is in the confidence interval and H0 is not rejected which means that there is no linear relationship.
I don\'t know if my anwer is right.
regress bwt lwt 189 6.69 0.0105 0.0345 0.0294 718.24 Source df MS Number of obs = Model Residual 3449062.64 96466235.9 F(1, 187) 1 3449062.64 ProbF 187515862.224 R-squared Adi R-squared - Total 99915298.6 188 531464.354 Root MSE bwt Coef. Std. Err. [95% Conf. Interval] 4.4299931.713244 2369.184228.4671 2.590.010 10.370.000 1.050222 1918.479 7.809763 2819.888 lwt consSolution

 Homework Sourse