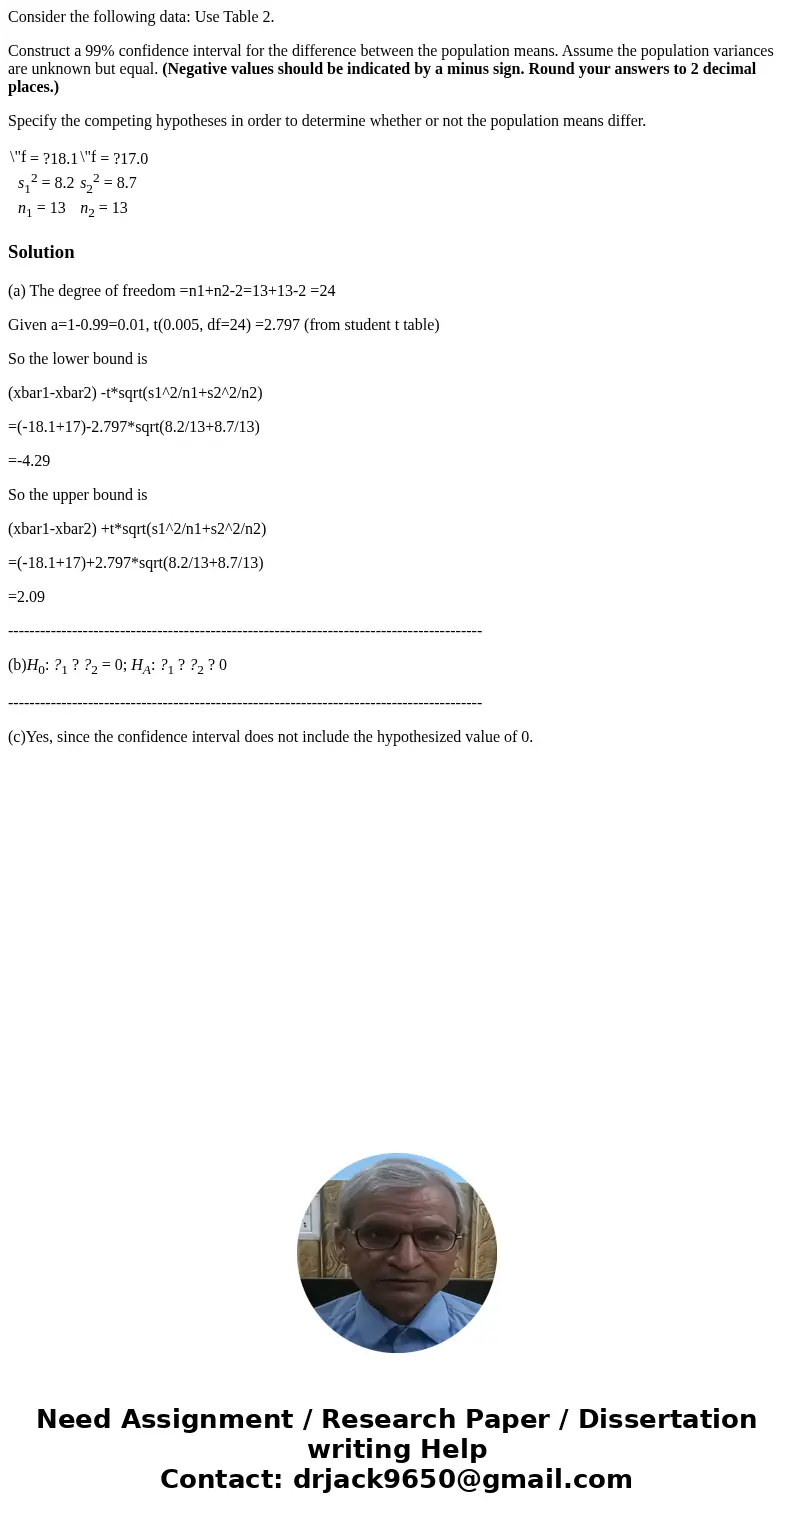
Consider the following data Use Table 2 Construct a 99 confi
Consider the following data: Use Table 2.
Construct a 99% confidence interval for the difference between the population means. Assume the population variances are unknown but equal. (Negative values should be indicated by a minus sign. Round your answers to 2 decimal places.)
Specify the competing hypotheses in order to determine whether or not the population means differ.
| s12 = 8.2 | s22 = 8.7 |
| n1 = 13 | n2 = 13 |
Solution
(a) The degree of freedom =n1+n2-2=13+13-2 =24
Given a=1-0.99=0.01, t(0.005, df=24) =2.797 (from student t table)
So the lower bound is
(xbar1-xbar2) -t*sqrt(s1^2/n1+s2^2/n2)
=(-18.1+17)-2.797*sqrt(8.2/13+8.7/13)
=-4.29
So the upper bound is
(xbar1-xbar2) +t*sqrt(s1^2/n1+s2^2/n2)
=(-18.1+17)+2.797*sqrt(8.2/13+8.7/13)
=2.09
-----------------------------------------------------------------------------------------
(b)H0: ?1 ? ?2 = 0; HA: ?1 ? ?2 ? 0
-----------------------------------------------------------------------------------------
(c)Yes, since the confidence interval does not include the hypothesized value of 0.

 Homework Sourse