1 A sample of 41 garages in a town has a mean of 192 cars wi
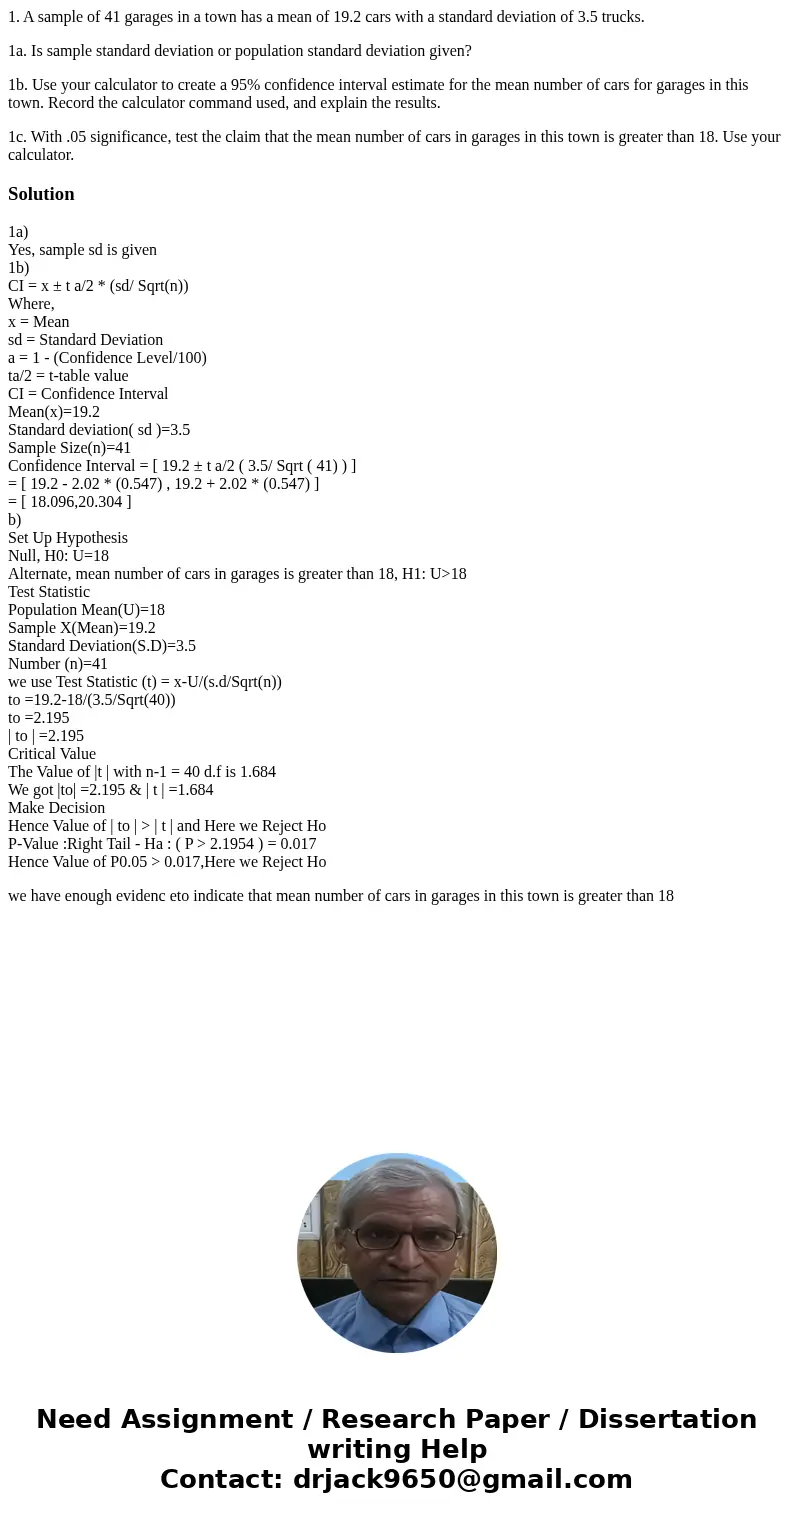
1. A sample of 41 garages in a town has a mean of 19.2 cars with a standard deviation of 3.5 trucks.
1a. Is sample standard deviation or population standard deviation given?
1b. Use your calculator to create a 95% confidence interval estimate for the mean number of cars for garages in this town. Record the calculator command used, and explain the results.
1c. With .05 significance, test the claim that the mean number of cars in garages in this town is greater than 18. Use your calculator.
Solution
1a)
Yes, sample sd is given
1b)
CI = x ± t a/2 * (sd/ Sqrt(n))
Where,
x = Mean
sd = Standard Deviation
a = 1 - (Confidence Level/100)
ta/2 = t-table value
CI = Confidence Interval
Mean(x)=19.2
Standard deviation( sd )=3.5
Sample Size(n)=41
Confidence Interval = [ 19.2 ± t a/2 ( 3.5/ Sqrt ( 41) ) ]
= [ 19.2 - 2.02 * (0.547) , 19.2 + 2.02 * (0.547) ]
= [ 18.096,20.304 ]
b)
Set Up Hypothesis
Null, H0: U=18
Alternate, mean number of cars in garages is greater than 18, H1: U>18
Test Statistic
Population Mean(U)=18
Sample X(Mean)=19.2
Standard Deviation(S.D)=3.5
Number (n)=41
we use Test Statistic (t) = x-U/(s.d/Sqrt(n))
to =19.2-18/(3.5/Sqrt(40))
to =2.195
| to | =2.195
Critical Value
The Value of |t | with n-1 = 40 d.f is 1.684
We got |to| =2.195 & | t | =1.684
Make Decision
Hence Value of | to | > | t | and Here we Reject Ho
P-Value :Right Tail - Ha : ( P > 2.1954 ) = 0.017
Hence Value of P0.05 > 0.017,Here we Reject Ho
we have enough evidenc eto indicate that mean number of cars in garages in this town is greater than 18

 Homework Sourse