ome File Edit View History Bookmarks People Window Help CD s
Solution
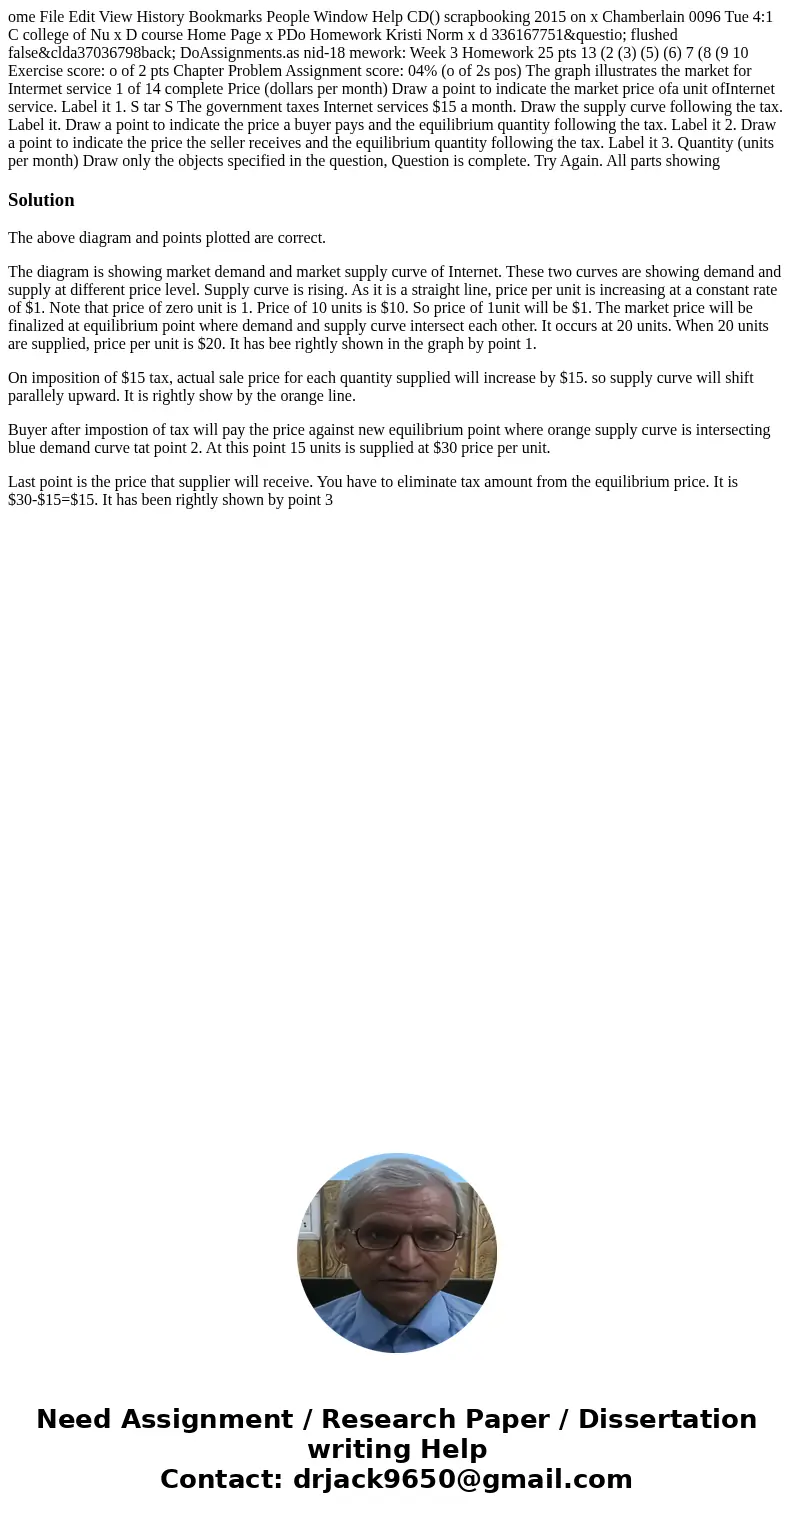
The above diagram and points plotted are correct.
The diagram is showing market demand and market supply curve of Internet. These two curves are showing demand and supply at different price level. Supply curve is rising. As it is a straight line, price per unit is increasing at a constant rate of $1. Note that price of zero unit is 1. Price of 10 units is $10. So price of 1unit will be $1. The market price will be finalized at equilibrium point where demand and supply curve intersect each other. It occurs at 20 units. When 20 units are supplied, price per unit is $20. It has bee rightly shown in the graph by point 1.
On imposition of $15 tax, actual sale price for each quantity supplied will increase by $15. so supply curve will shift parallely upward. It is rightly show by the orange line.
Buyer after impostion of tax will pay the price against new equilibrium point where orange supply curve is intersecting blue demand curve tat point 2. At this point 15 units is supplied at $30 price per unit.
Last point is the price that supplier will receive. You have to eliminate tax amount from the equilibrium price. It is $30-$15=$15. It has been rightly shown by point 3

 Homework Sourse