The following data show the number of hours studied for an e
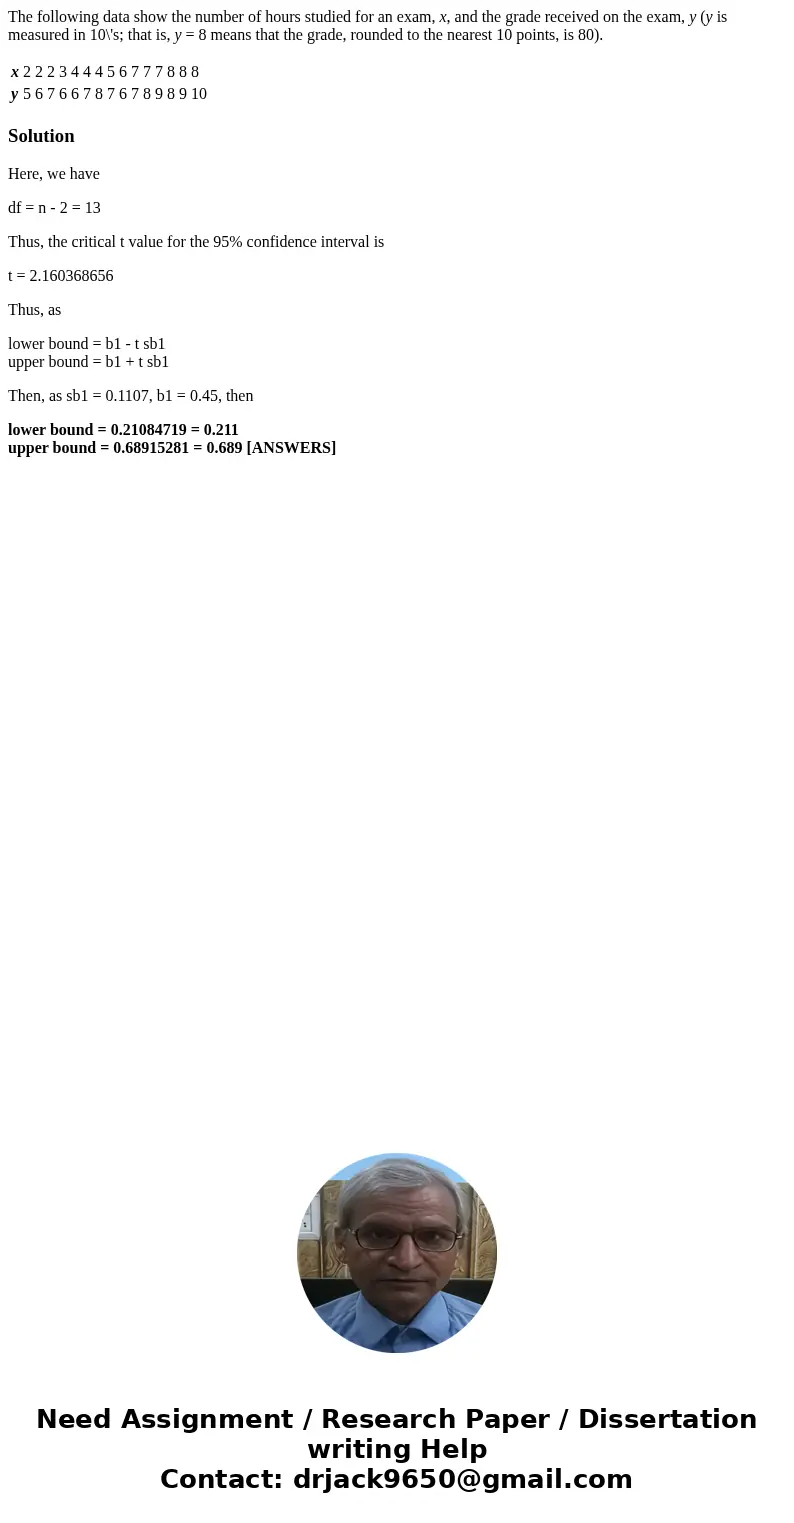
The following data show the number of hours studied for an exam, x, and the grade received on the exam, y (y is measured in 10\'s; that is, y = 8 means that the grade, rounded to the nearest 10 points, is 80).
| x | 2 | 2 | 2 | 3 | 4 | 4 | 4 | 5 | 6 | 7 | 7 | 7 | 8 | 8 | 8 |
|---|---|---|---|---|---|---|---|---|---|---|---|---|---|---|---|
| y | 5 | 6 | 7 | 6 | 6 | 7 | 8 | 7 | 6 | 7 | 8 | 9 | 8 | 9 | 10 |
Solution
Here, we have
df = n - 2 = 13
Thus, the critical t value for the 95% confidence interval is
t = 2.160368656
Thus, as
lower bound = b1 - t sb1
upper bound = b1 + t sb1
Then, as sb1 = 0.1107, b1 = 0.45, then
lower bound = 0.21084719 = 0.211
upper bound = 0.68915281 = 0.689 [ANSWERS]

 Homework Sourse