For the following questions use this information from Thomps
For the following questions, use this information from Thompson Corporation’s annual reports:
1) Compute a simple index for the revenue of Thompson. Use 2004 as the base period. What can you conclude about the change in revenue over the period?
2) Compute a simple index for the revenue of Thompson using the period 2004–06 as the base. What can you conclude about the change in revenue over the period?
3) Compute a simple index for the number of employees for Thompson. Use 2004 as the base period. What can you conclude about the change in the number of employees over the period?
4) Compute a simple index for the number of employees for Thompson using the period 2004–06 as the base. What can you conclude about the change in the number of employees over the period? Do your calculations in Excel
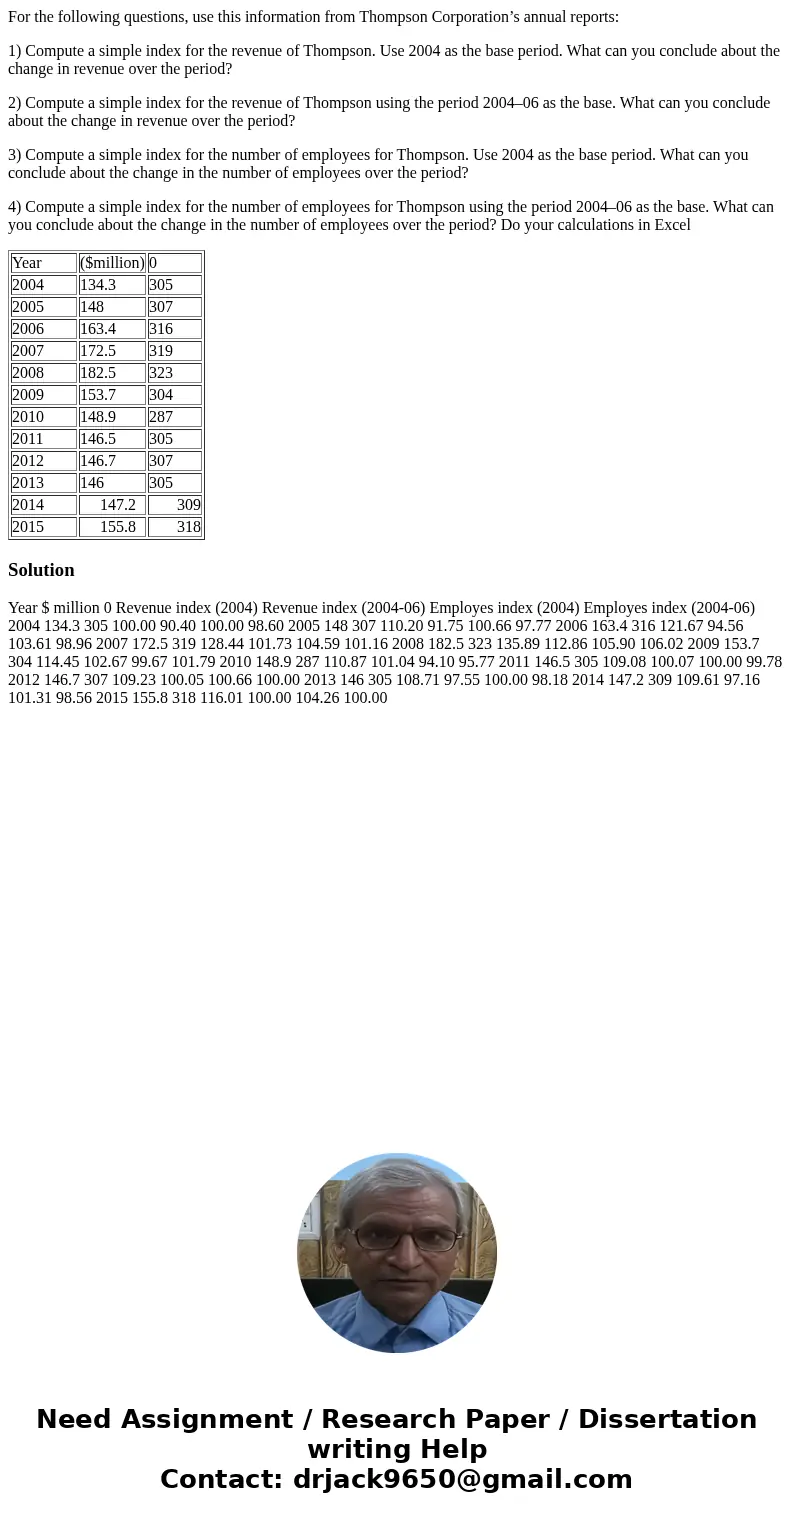
| Year | ($million) | 0 |
| 2004 | 134.3 | 305 |
| 2005 | 148 | 307 |
| 2006 | 163.4 | 316 |
| 2007 | 172.5 | 319 |
| 2008 | 182.5 | 323 |
| 2009 | 153.7 | 304 |
| 2010 | 148.9 | 287 |
| 2011 | 146.5 | 305 |
| 2012 | 146.7 | 307 |
| 2013 | 146 | 305 |
| 2014 | 147.2 | 309 |
| 2015 | 155.8 | 318 |
Solution
Year $ million 0 Revenue index (2004) Revenue index (2004-06) Employes index (2004) Employes index (2004-06) 2004 134.3 305 100.00 90.40 100.00 98.60 2005 148 307 110.20 91.75 100.66 97.77 2006 163.4 316 121.67 94.56 103.61 98.96 2007 172.5 319 128.44 101.73 104.59 101.16 2008 182.5 323 135.89 112.86 105.90 106.02 2009 153.7 304 114.45 102.67 99.67 101.79 2010 148.9 287 110.87 101.04 94.10 95.77 2011 146.5 305 109.08 100.07 100.00 99.78 2012 146.7 307 109.23 100.05 100.66 100.00 2013 146 305 108.71 97.55 100.00 98.18 2014 147.2 309 109.61 97.16 101.31 98.56 2015 155.8 318 116.01 100.00 104.26 100.00
 Homework Sourse