Consider the data on new orders for computers and electronic
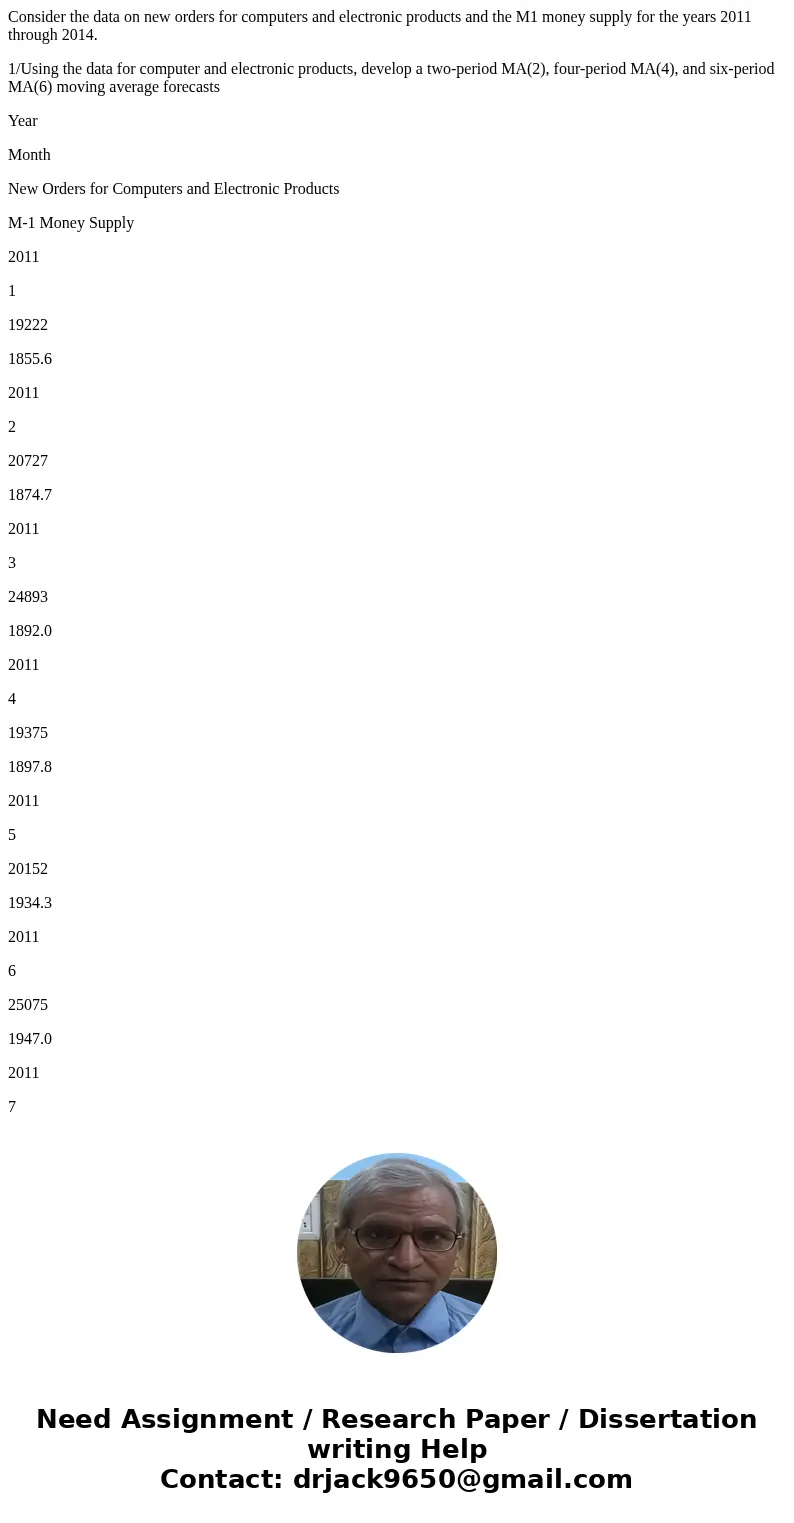
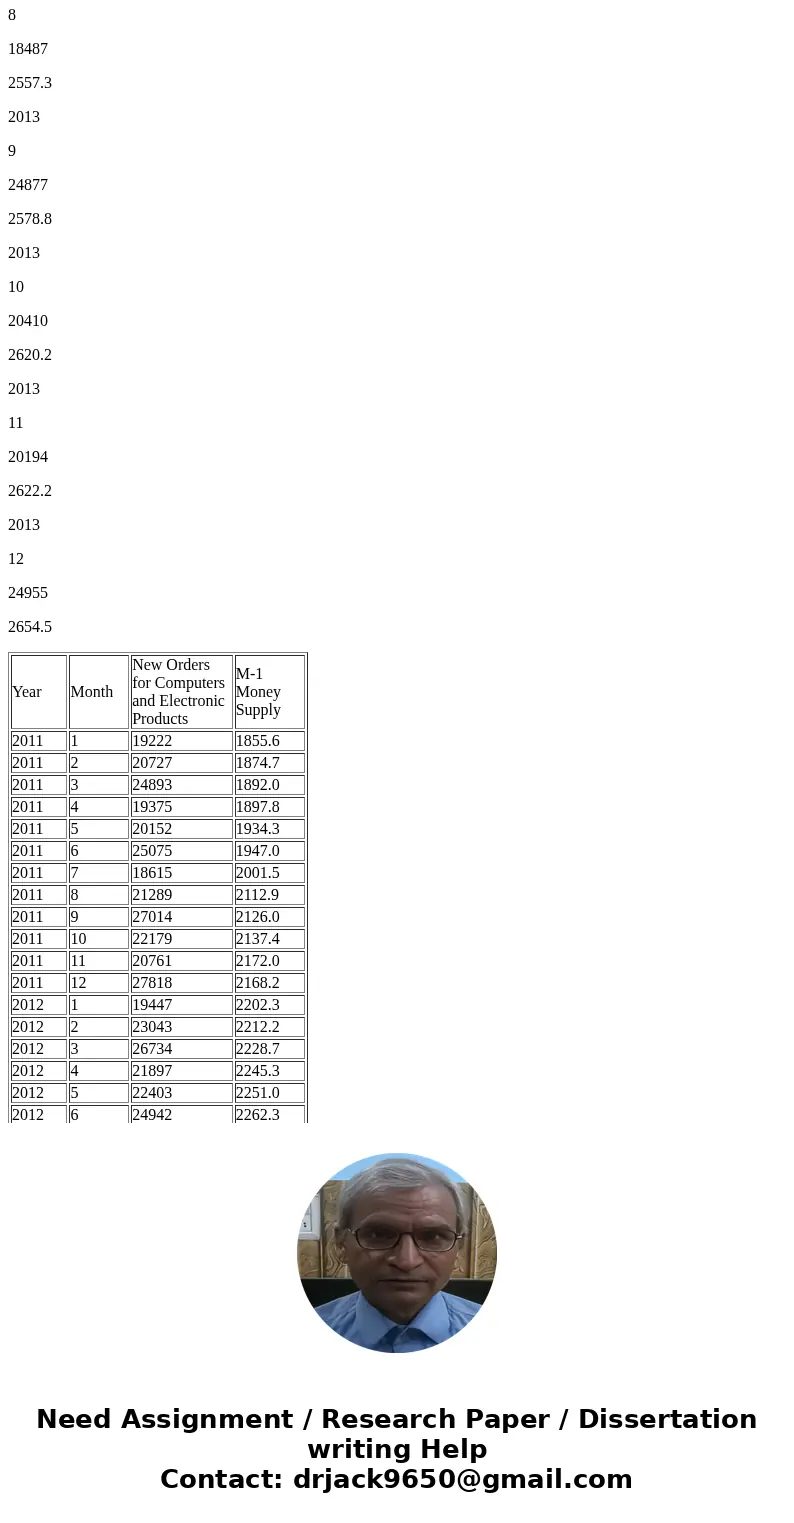
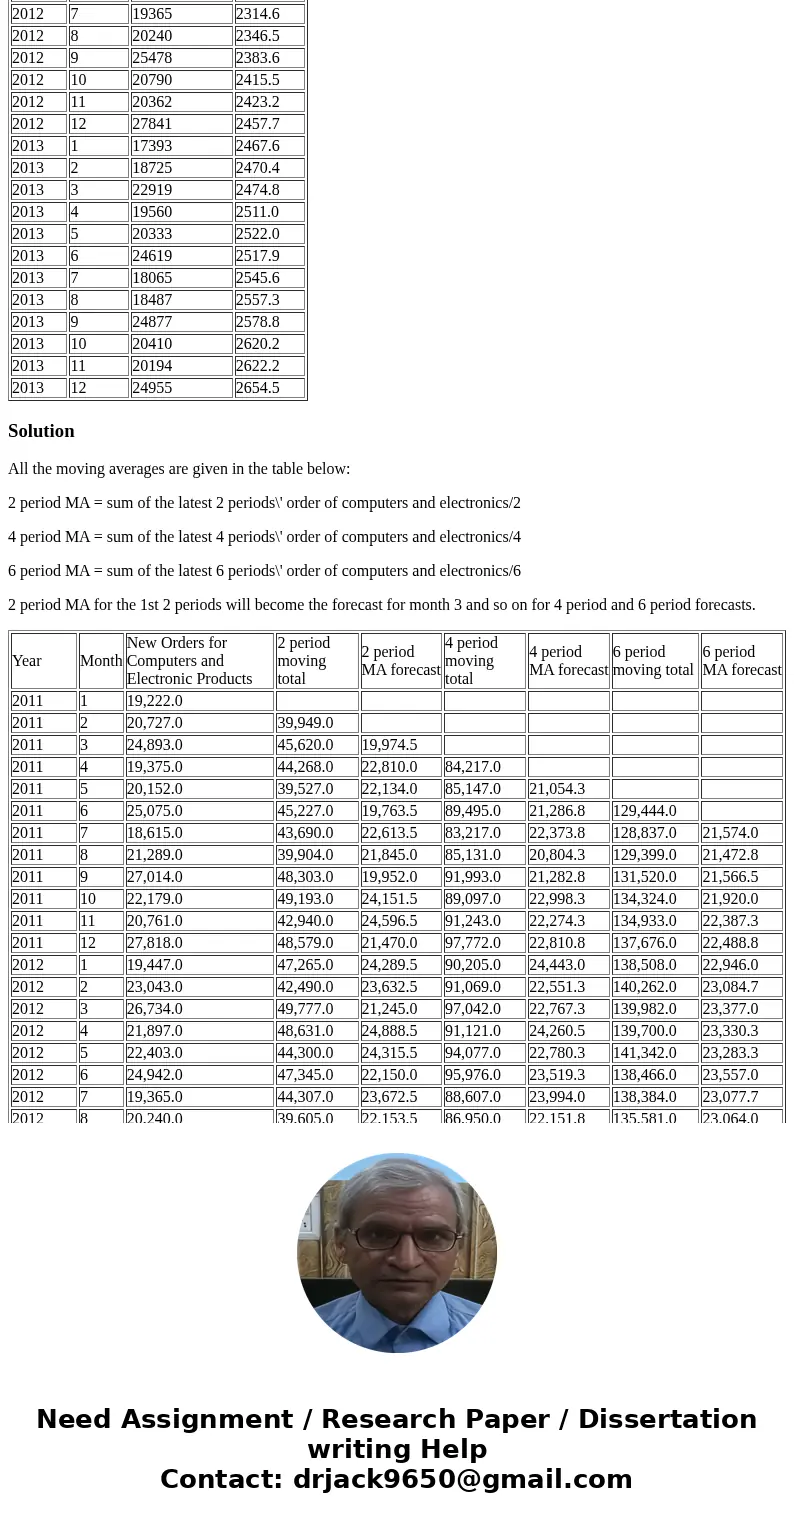
Consider the data on new orders for computers and electronic products and the M1 money supply for the years 2011 through 2014.
1/Using the data for computer and electronic products, develop a two-period MA(2), four-period MA(4), and six-period MA(6) moving average forecasts
Year
Month
New Orders for Computers and Electronic Products
M-1 Money Supply
2011
1
19222
1855.6
2011
2
20727
1874.7
2011
3
24893
1892.0
2011
4
19375
1897.8
2011
5
20152
1934.3
2011
6
25075
1947.0
2011
7
18615
2001.5
2011
8
21289
2112.9
2011
9
27014
2126.0
2011
10
22179
2137.4
2011
11
20761
2172.0
2011
12
27818
2168.2
2012
1
19447
2202.3
2012
2
23043
2212.2
2012
3
26734
2228.7
2012
4
21897
2245.3
2012
5
22403
2251.0
2012
6
24942
2262.3
2012
7
19365
2314.6
2012
8
20240
2346.5
2012
9
25478
2383.6
2012
10
20790
2415.5
2012
11
20362
2423.2
2012
12
27841
2457.7
2013
1
17393
2467.6
2013
2
18725
2470.4
2013
3
22919
2474.8
2013
4
19560
2511.0
2013
5
20333
2522.0
2013
6
24619
2517.9
2013
7
18065
2545.6
2013
8
18487
2557.3
2013
9
24877
2578.8
2013
10
20410
2620.2
2013
11
20194
2622.2
2013
12
24955
2654.5
| Year | Month | New Orders for Computers and Electronic Products | M-1 Money Supply |
| 2011 | 1 | 19222 | 1855.6 |
| 2011 | 2 | 20727 | 1874.7 |
| 2011 | 3 | 24893 | 1892.0 |
| 2011 | 4 | 19375 | 1897.8 |
| 2011 | 5 | 20152 | 1934.3 |
| 2011 | 6 | 25075 | 1947.0 |
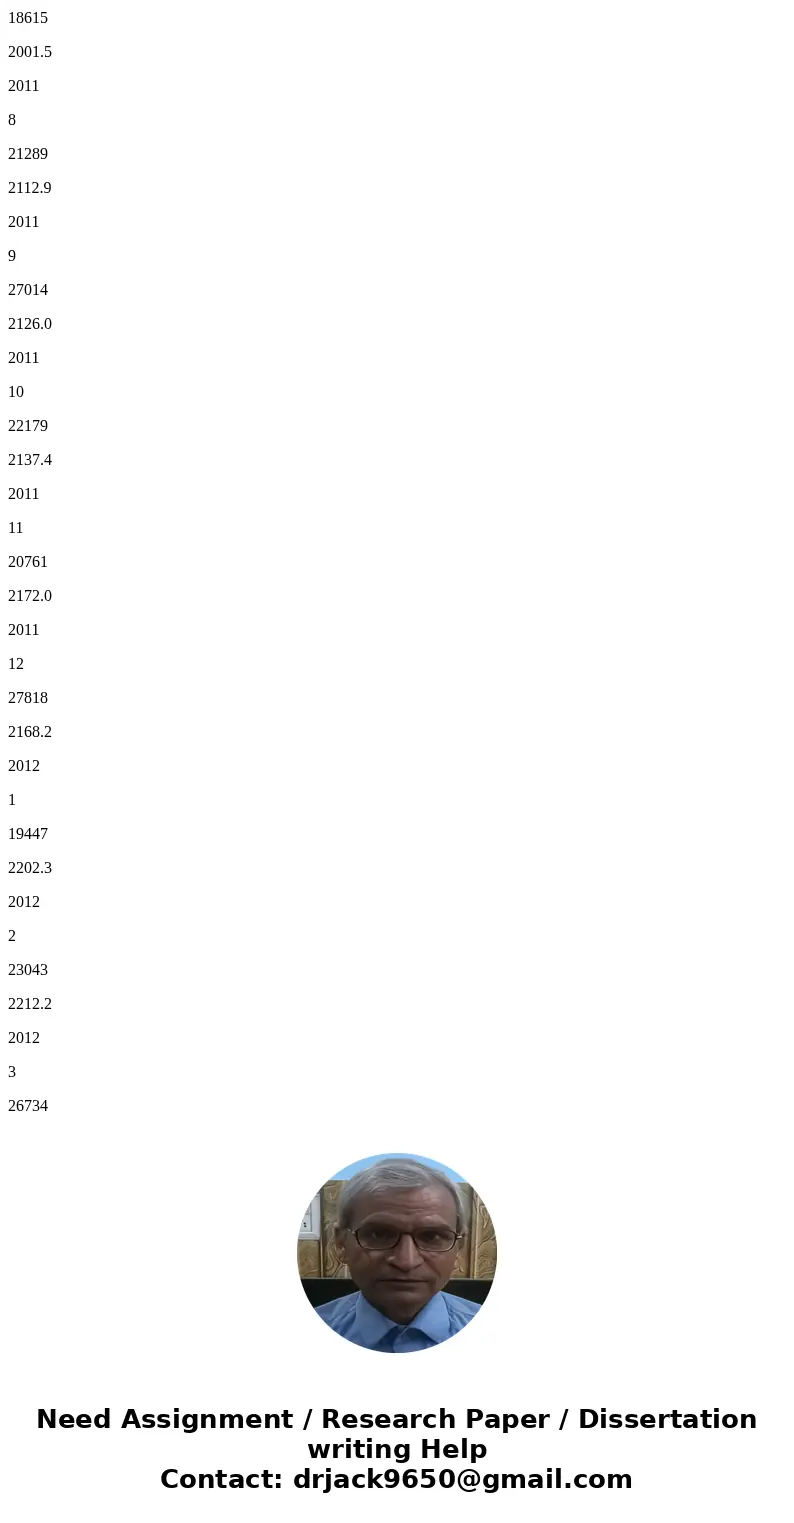
| 2011 | 7 | 18615 | 2001.5 |
| 2011 | 8 | 21289 | 2112.9 |
| 2011 | 9 | 27014 | 2126.0 |
| 2011 | 10 | 22179 | 2137.4 |
| 2011 | 11 | 20761 | 2172.0 |
| 2011 | 12 | 27818 | 2168.2 |
| 2012 | 1 | 19447 | 2202.3 |
| 2012 | 2 | 23043 | 2212.2 |
| 2012 | 3 | 26734 | 2228.7 |
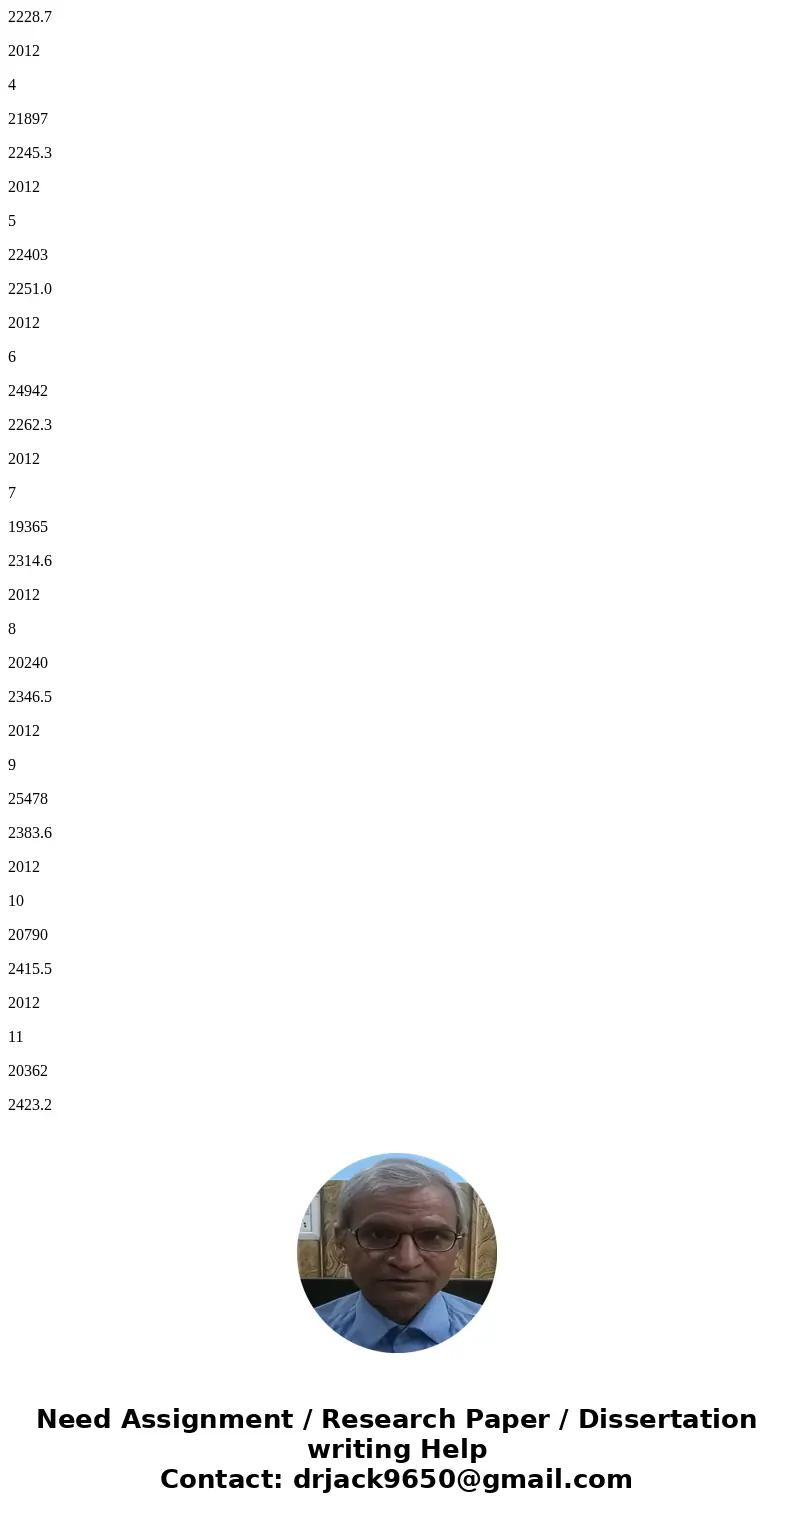
| 2012 | 4 | 21897 | 2245.3 |
| 2012 | 5 | 22403 | 2251.0 |
| 2012 | 6 | 24942 | 2262.3 |
| 2012 | 7 | 19365 | 2314.6 |
| 2012 | 8 | 20240 | 2346.5 |
| 2012 | 9 | 25478 | 2383.6 |
| 2012 | 10 | 20790 | 2415.5 |
| 2012 | 11 | 20362 | 2423.2 |
| 2012 | 12 | 27841 | 2457.7 |
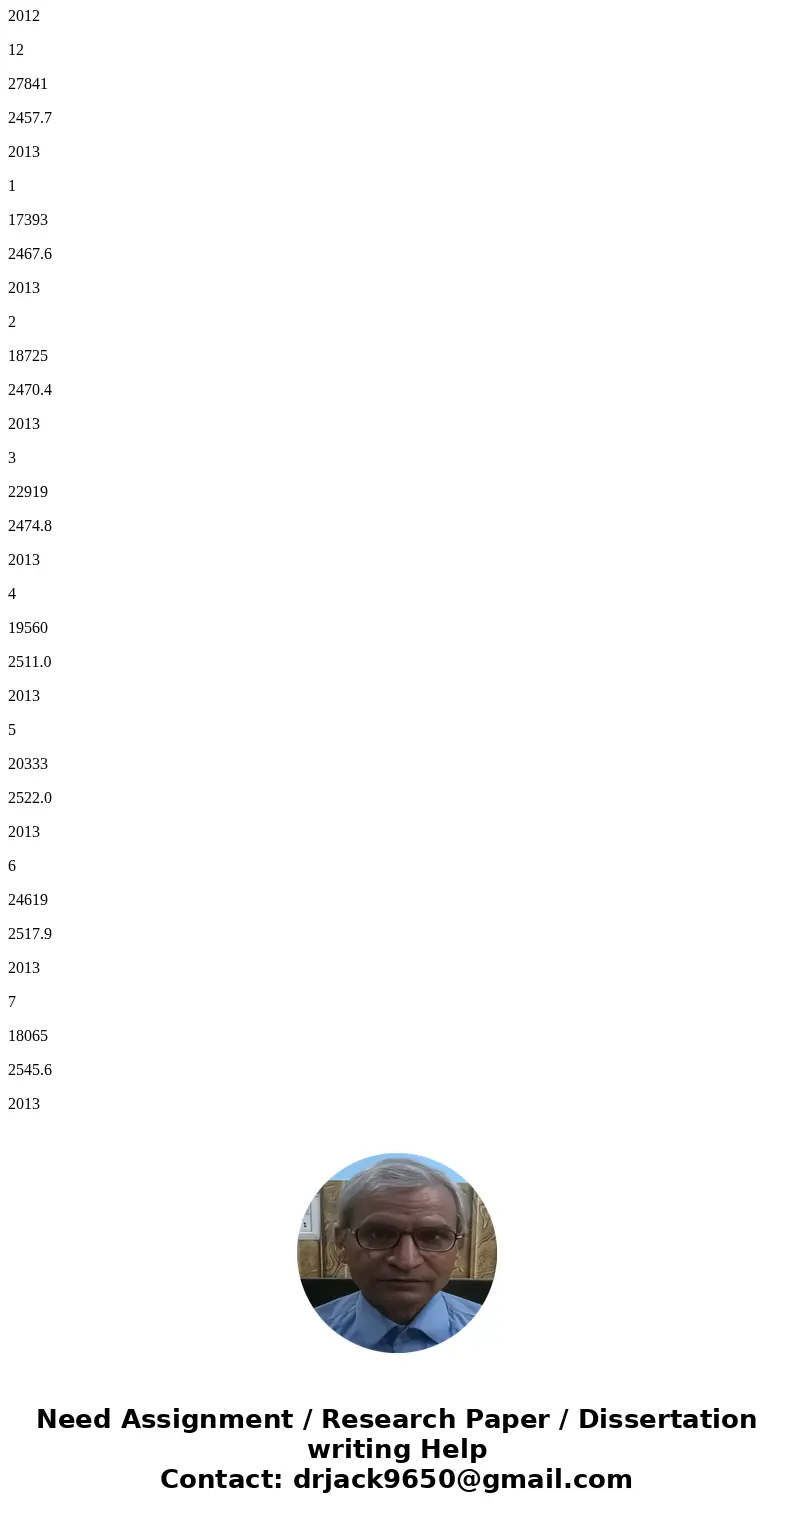
| 2013 | 1 | 17393 | 2467.6 |
| 2013 | 2 | 18725 | 2470.4 |
| 2013 | 3 | 22919 | 2474.8 |
| 2013 | 4 | 19560 | 2511.0 |
| 2013 | 5 | 20333 | 2522.0 |
| 2013 | 6 | 24619 | 2517.9 |
| 2013 | 7 | 18065 | 2545.6 |
| 2013 | 8 | 18487 | 2557.3 |
| 2013 | 9 | 24877 | 2578.8 |
| 2013 | 10 | 20410 | 2620.2 |
| 2013 | 11 | 20194 | 2622.2 |
| 2013 | 12 | 24955 | 2654.5 |
Solution
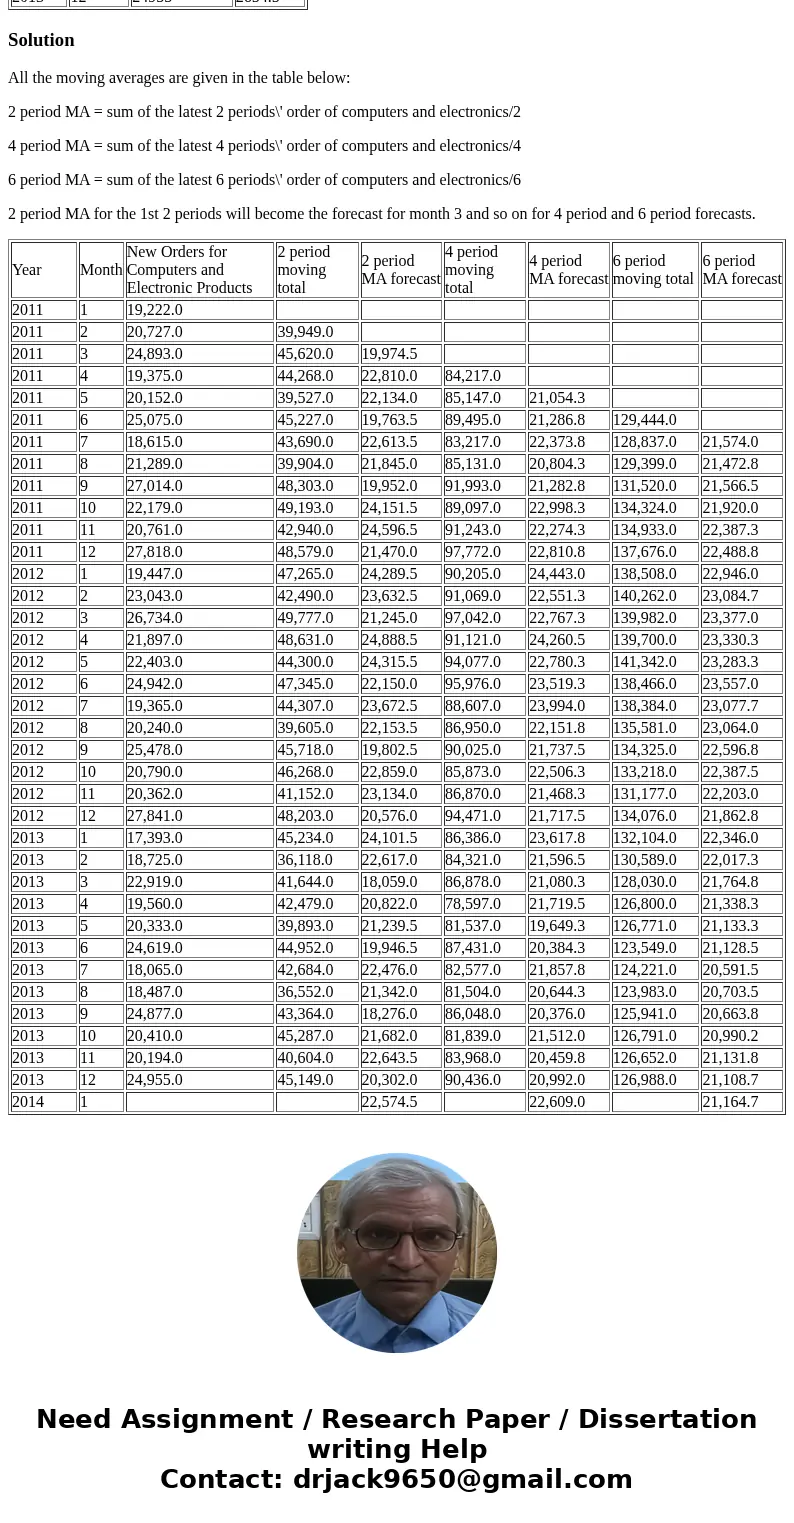
All the moving averages are given in the table below:
2 period MA = sum of the latest 2 periods\' order of computers and electronics/2
4 period MA = sum of the latest 4 periods\' order of computers and electronics/4
6 period MA = sum of the latest 6 periods\' order of computers and electronics/6
2 period MA for the 1st 2 periods will become the forecast for month 3 and so on for 4 period and 6 period forecasts.
| Year | Month | New Orders for Computers and Electronic Products | 2 period moving total | 2 period MA forecast | 4 period moving total | 4 period MA forecast | 6 period moving total | 6 period MA forecast |
| 2011 | 1 | 19,222.0 | ||||||
| 2011 | 2 | 20,727.0 | 39,949.0 | |||||
| 2011 | 3 | 24,893.0 | 45,620.0 | 19,974.5 | ||||
| 2011 | 4 | 19,375.0 | 44,268.0 | 22,810.0 | 84,217.0 | |||
| 2011 | 5 | 20,152.0 | 39,527.0 | 22,134.0 | 85,147.0 | 21,054.3 | ||
| 2011 | 6 | 25,075.0 | 45,227.0 | 19,763.5 | 89,495.0 | 21,286.8 | 129,444.0 | |
| 2011 | 7 | 18,615.0 | 43,690.0 | 22,613.5 | 83,217.0 | 22,373.8 | 128,837.0 | 21,574.0 |
| 2011 | 8 | 21,289.0 | 39,904.0 | 21,845.0 | 85,131.0 | 20,804.3 | 129,399.0 | 21,472.8 |
| 2011 | 9 | 27,014.0 | 48,303.0 | 19,952.0 | 91,993.0 | 21,282.8 | 131,520.0 | 21,566.5 |
| 2011 | 10 | 22,179.0 | 49,193.0 | 24,151.5 | 89,097.0 | 22,998.3 | 134,324.0 | 21,920.0 |
| 2011 | 11 | 20,761.0 | 42,940.0 | 24,596.5 | 91,243.0 | 22,274.3 | 134,933.0 | 22,387.3 |
| 2011 | 12 | 27,818.0 | 48,579.0 | 21,470.0 | 97,772.0 | 22,810.8 | 137,676.0 | 22,488.8 |
| 2012 | 1 | 19,447.0 | 47,265.0 | 24,289.5 | 90,205.0 | 24,443.0 | 138,508.0 | 22,946.0 |
| 2012 | 2 | 23,043.0 | 42,490.0 | 23,632.5 | 91,069.0 | 22,551.3 | 140,262.0 | 23,084.7 |
| 2012 | 3 | 26,734.0 | 49,777.0 | 21,245.0 | 97,042.0 | 22,767.3 | 139,982.0 | 23,377.0 |
| 2012 | 4 | 21,897.0 | 48,631.0 | 24,888.5 | 91,121.0 | 24,260.5 | 139,700.0 | 23,330.3 |
| 2012 | 5 | 22,403.0 | 44,300.0 | 24,315.5 | 94,077.0 | 22,780.3 | 141,342.0 | 23,283.3 |
| 2012 | 6 | 24,942.0 | 47,345.0 | 22,150.0 | 95,976.0 | 23,519.3 | 138,466.0 | 23,557.0 |
| 2012 | 7 | 19,365.0 | 44,307.0 | 23,672.5 | 88,607.0 | 23,994.0 | 138,384.0 | 23,077.7 |
| 2012 | 8 | 20,240.0 | 39,605.0 | 22,153.5 | 86,950.0 | 22,151.8 | 135,581.0 | 23,064.0 |
| 2012 | 9 | 25,478.0 | 45,718.0 | 19,802.5 | 90,025.0 | 21,737.5 | 134,325.0 | 22,596.8 |
| 2012 | 10 | 20,790.0 | 46,268.0 | 22,859.0 | 85,873.0 | 22,506.3 | 133,218.0 | 22,387.5 |
| 2012 | 11 | 20,362.0 | 41,152.0 | 23,134.0 | 86,870.0 | 21,468.3 | 131,177.0 | 22,203.0 |
| 2012 | 12 | 27,841.0 | 48,203.0 | 20,576.0 | 94,471.0 | 21,717.5 | 134,076.0 | 21,862.8 |
| 2013 | 1 | 17,393.0 | 45,234.0 | 24,101.5 | 86,386.0 | 23,617.8 | 132,104.0 | 22,346.0 |
| 2013 | 2 | 18,725.0 | 36,118.0 | 22,617.0 | 84,321.0 | 21,596.5 | 130,589.0 | 22,017.3 |
| 2013 | 3 | 22,919.0 | 41,644.0 | 18,059.0 | 86,878.0 | 21,080.3 | 128,030.0 | 21,764.8 |
| 2013 | 4 | 19,560.0 | 42,479.0 | 20,822.0 | 78,597.0 | 21,719.5 | 126,800.0 | 21,338.3 |
| 2013 | 5 | 20,333.0 | 39,893.0 | 21,239.5 | 81,537.0 | 19,649.3 | 126,771.0 | 21,133.3 |
| 2013 | 6 | 24,619.0 | 44,952.0 | 19,946.5 | 87,431.0 | 20,384.3 | 123,549.0 | 21,128.5 |
| 2013 | 7 | 18,065.0 | 42,684.0 | 22,476.0 | 82,577.0 | 21,857.8 | 124,221.0 | 20,591.5 |
| 2013 | 8 | 18,487.0 | 36,552.0 | 21,342.0 | 81,504.0 | 20,644.3 | 123,983.0 | 20,703.5 |
| 2013 | 9 | 24,877.0 | 43,364.0 | 18,276.0 | 86,048.0 | 20,376.0 | 125,941.0 | 20,663.8 |
| 2013 | 10 | 20,410.0 | 45,287.0 | 21,682.0 | 81,839.0 | 21,512.0 | 126,791.0 | 20,990.2 |
| 2013 | 11 | 20,194.0 | 40,604.0 | 22,643.5 | 83,968.0 | 20,459.8 | 126,652.0 | 21,131.8 |
| 2013 | 12 | 24,955.0 | 45,149.0 | 20,302.0 | 90,436.0 | 20,992.0 | 126,988.0 | 21,108.7 |
| 2014 | 1 | 22,574.5 | 22,609.0 | 21,164.7 |
 Homework Sourse