The data that follow are coded serious head injury data that
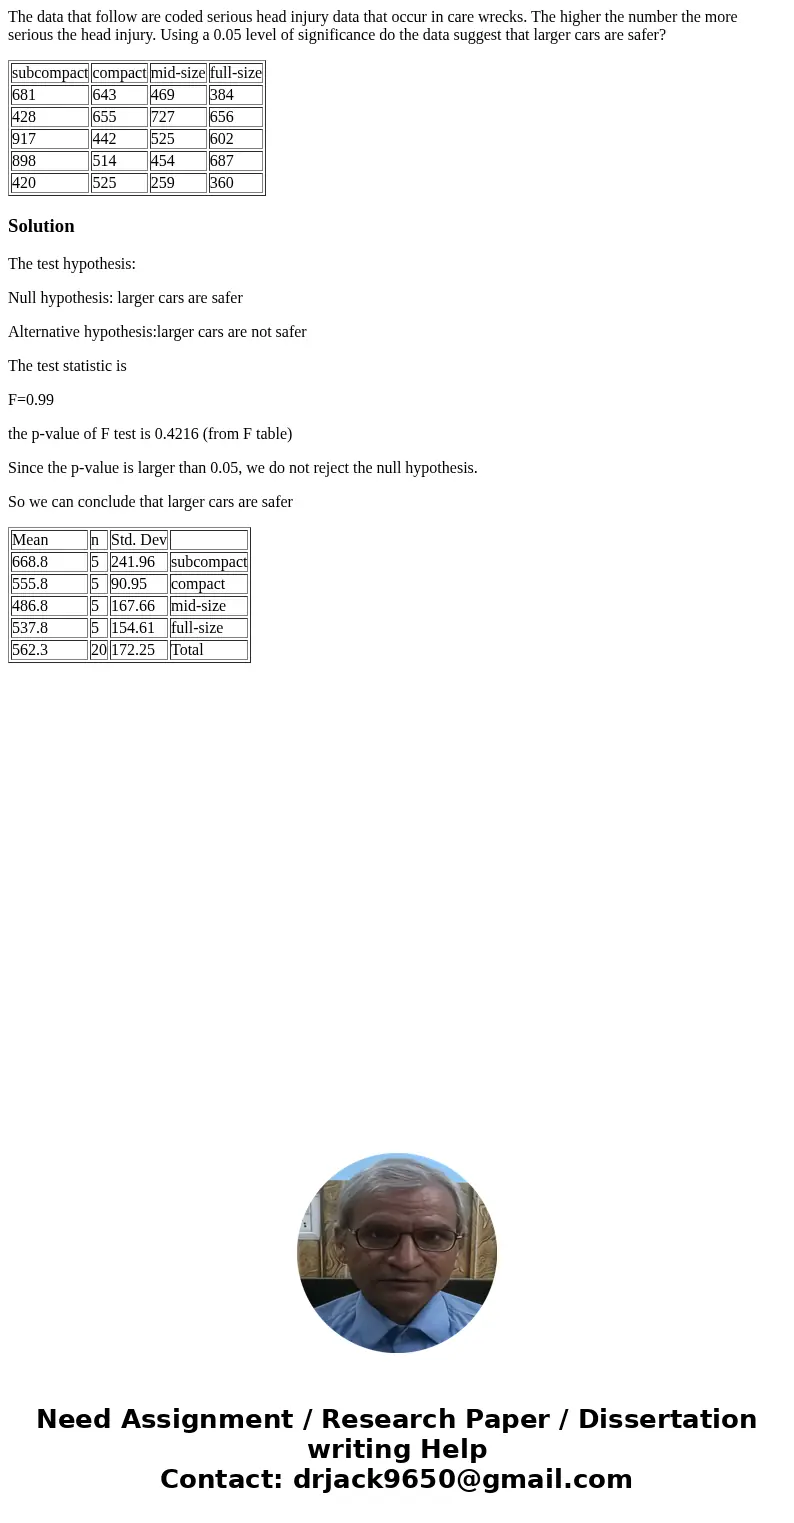
The data that follow are coded serious head injury data that occur in care wrecks. The higher the number the more serious the head injury. Using a 0.05 level of significance do the data suggest that larger cars are safer?
| subcompact | compact | mid-size | full-size |
| 681 | 643 | 469 | 384 |
| 428 | 655 | 727 | 656 |
| 917 | 442 | 525 | 602 |
| 898 | 514 | 454 | 687 |
| 420 | 525 | 259 | 360 |
Solution
The test hypothesis:
Null hypothesis: larger cars are safer
Alternative hypothesis:larger cars are not safer
The test statistic is
F=0.99
the p-value of F test is 0.4216 (from F table)
Since the p-value is larger than 0.05, we do not reject the null hypothesis.
So we can conclude that larger cars are safer
| Mean | n | Std. Dev | |
| 668.8 | 5 | 241.96 | subcompact |
| 555.8 | 5 | 90.95 | compact |
| 486.8 | 5 | 167.66 | mid-size |
| 537.8 | 5 | 154.61 | full-size |
| 562.3 | 20 | 172.25 | Total |

 Homework Sourse