Use the monthly data September 2013 November 2014 provided
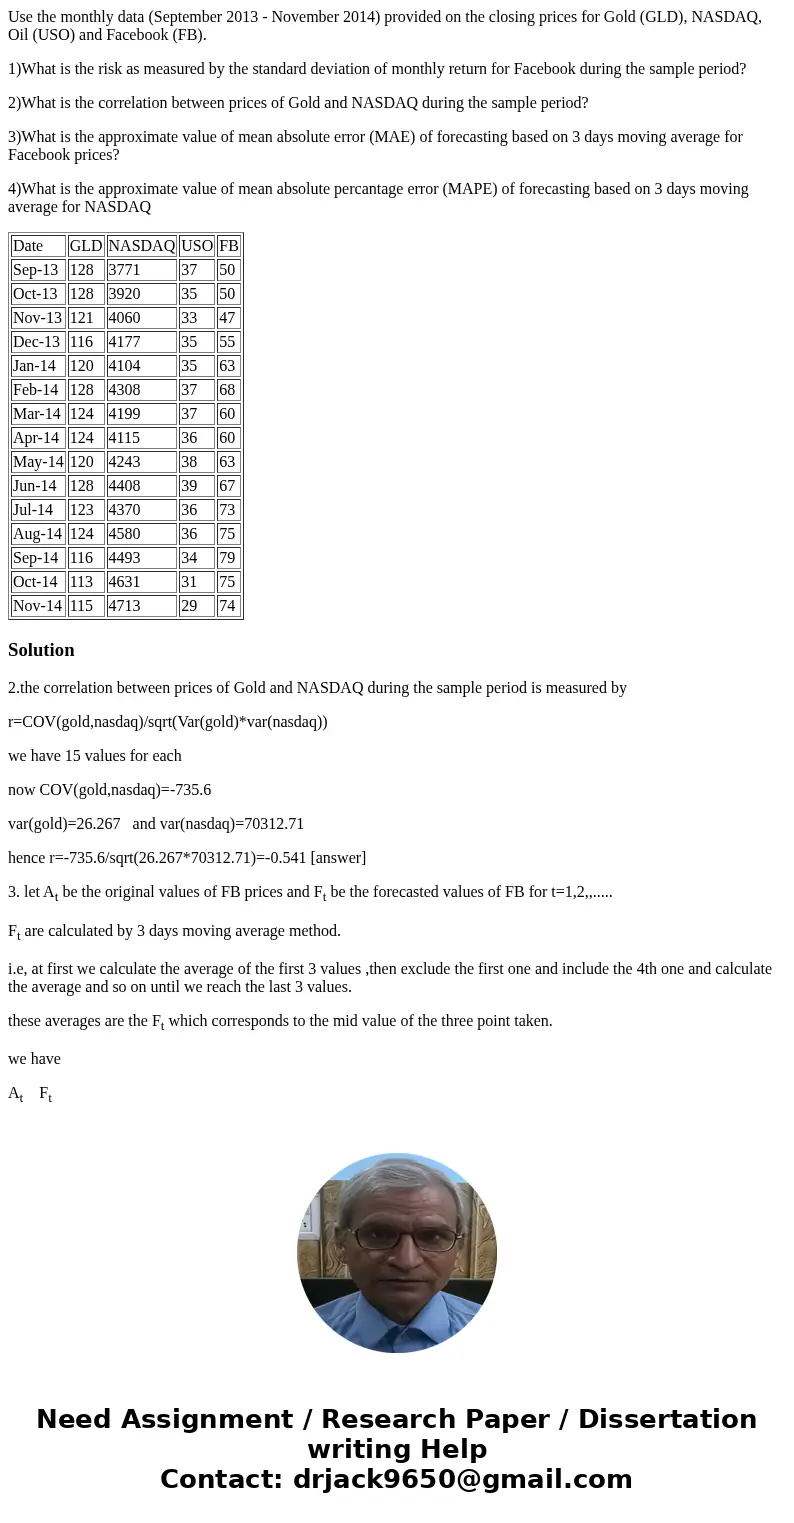
Use the monthly data (September 2013 - November 2014) provided on the closing prices for Gold (GLD), NASDAQ, Oil (USO) and Facebook (FB).
1)What is the risk as measured by the standard deviation of monthly return for Facebook during the sample period?
2)What is the correlation between prices of Gold and NASDAQ during the sample period?
3)What is the approximate value of mean absolute error (MAE) of forecasting based on 3 days moving average for Facebook prices?
4)What is the approximate value of mean absolute percantage error (MAPE) of forecasting based on 3 days moving average for NASDAQ
| Date | GLD | NASDAQ | USO | FB |
| Sep-13 | 128 | 3771 | 37 | 50 |
| Oct-13 | 128 | 3920 | 35 | 50 |
| Nov-13 | 121 | 4060 | 33 | 47 |
| Dec-13 | 116 | 4177 | 35 | 55 |
| Jan-14 | 120 | 4104 | 35 | 63 |
| Feb-14 | 128 | 4308 | 37 | 68 |
| Mar-14 | 124 | 4199 | 37 | 60 |
| Apr-14 | 124 | 4115 | 36 | 60 |
| May-14 | 120 | 4243 | 38 | 63 |
| Jun-14 | 128 | 4408 | 39 | 67 |
| Jul-14 | 123 | 4370 | 36 | 73 |
| Aug-14 | 124 | 4580 | 36 | 75 |
| Sep-14 | 116 | 4493 | 34 | 79 |
| Oct-14 | 113 | 4631 | 31 | 75 |
| Nov-14 | 115 | 4713 | 29 | 74 |
Solution
2.the correlation between prices of Gold and NASDAQ during the sample period is measured by
r=COV(gold,nasdaq)/sqrt(Var(gold)*var(nasdaq))
we have 15 values for each
now COV(gold,nasdaq)=-735.6
var(gold)=26.267 and var(nasdaq)=70312.71
hence r=-735.6/sqrt(26.267*70312.71)=-0.541 [answer]
3. let At be the original values of FB prices and Ft be the forecasted values of FB for t=1,2,,.....
Ft are calculated by 3 days moving average method.
i.e, at first we calculate the average of the first 3 values ,then exclude the first one and include the 4th one and calculate the average and so on until we reach the last 3 values.
these averages are the Ft which corresponds to the mid value of the three point taken.
we have
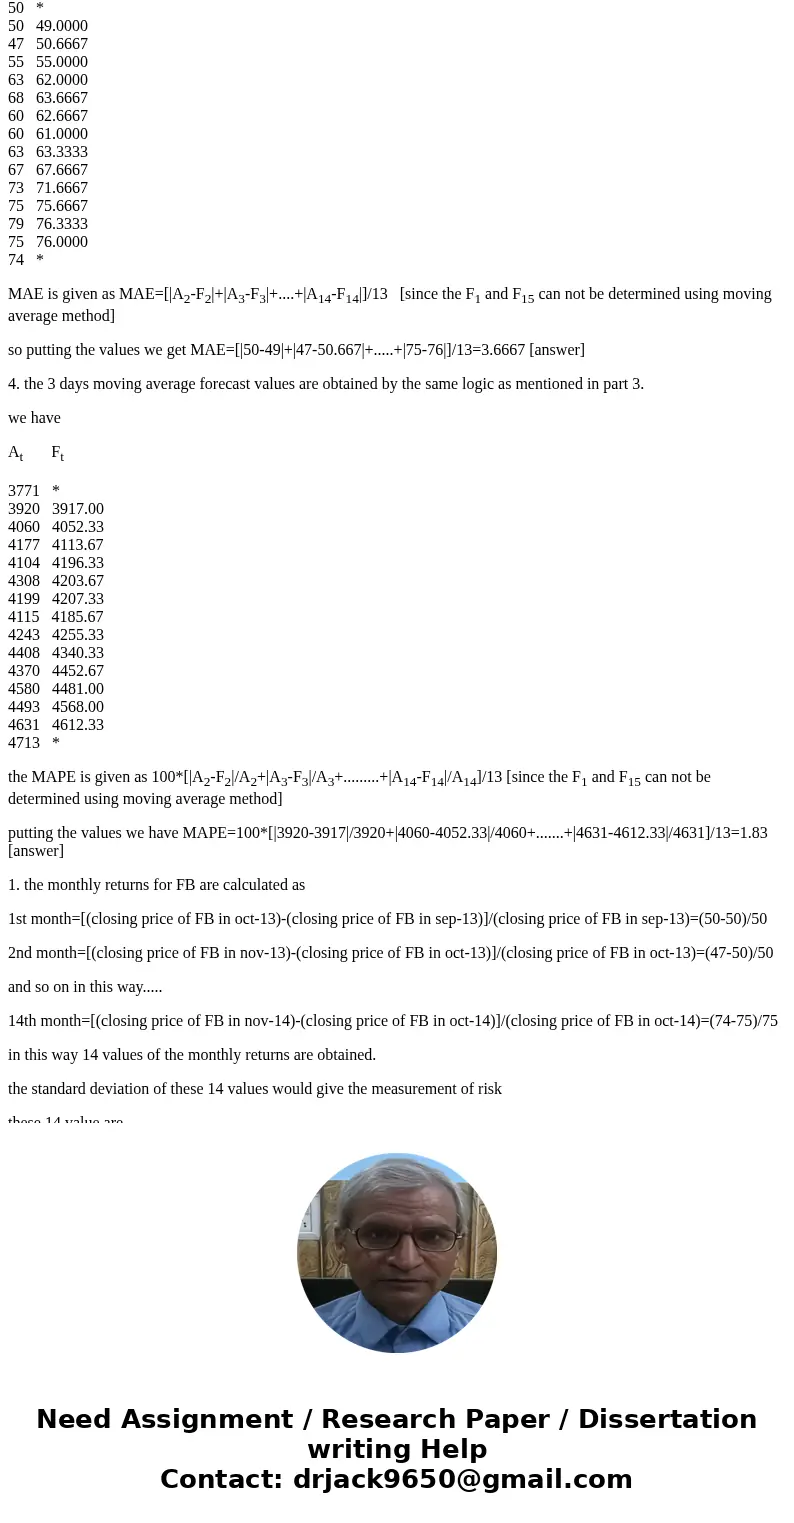
At Ft
50 *
50 49.0000
47 50.6667
55 55.0000
63 62.0000
68 63.6667
60 62.6667
60 61.0000
63 63.3333
67 67.6667
73 71.6667
75 75.6667
79 76.3333
75 76.0000
74 *
MAE is given as MAE=[|A2-F2|+|A3-F3|+....+|A14-F14|]/13 [since the F1 and F15 can not be determined using moving average method]
so putting the values we get MAE=[|50-49|+|47-50.667|+.....+|75-76|]/13=3.6667 [answer]
4. the 3 days moving average forecast values are obtained by the same logic as mentioned in part 3.
we have
At Ft
3771 *
3920 3917.00
4060 4052.33
4177 4113.67
4104 4196.33
4308 4203.67
4199 4207.33
4115 4185.67
4243 4255.33
4408 4340.33
4370 4452.67
4580 4481.00
4493 4568.00
4631 4612.33
4713 *
the MAPE is given as 100*[|A2-F2|/A2+|A3-F3|/A3+.........+|A14-F14|/A14]/13 [since the F1 and F15 can not be determined using moving average method]
putting the values we have MAPE=100*[|3920-3917|/3920+|4060-4052.33|/4060+.......+|4631-4612.33|/4631]/13=1.83 [answer]
1. the monthly returns for FB are calculated as
1st month=[(closing price of FB in oct-13)-(closing price of FB in sep-13)]/(closing price of FB in sep-13)=(50-50)/50
2nd month=[(closing price of FB in nov-13)-(closing price of FB in oct-13)]/(closing price of FB in oct-13)=(47-50)/50
and so on in this way.....
14th month=[(closing price of FB in nov-14)-(closing price of FB in oct-14)]/(closing price of FB in oct-14)=(74-75)/75
in this way 14 values of the monthly returns are obtained.
the standard deviation of these 14 values would give the measurement of risk
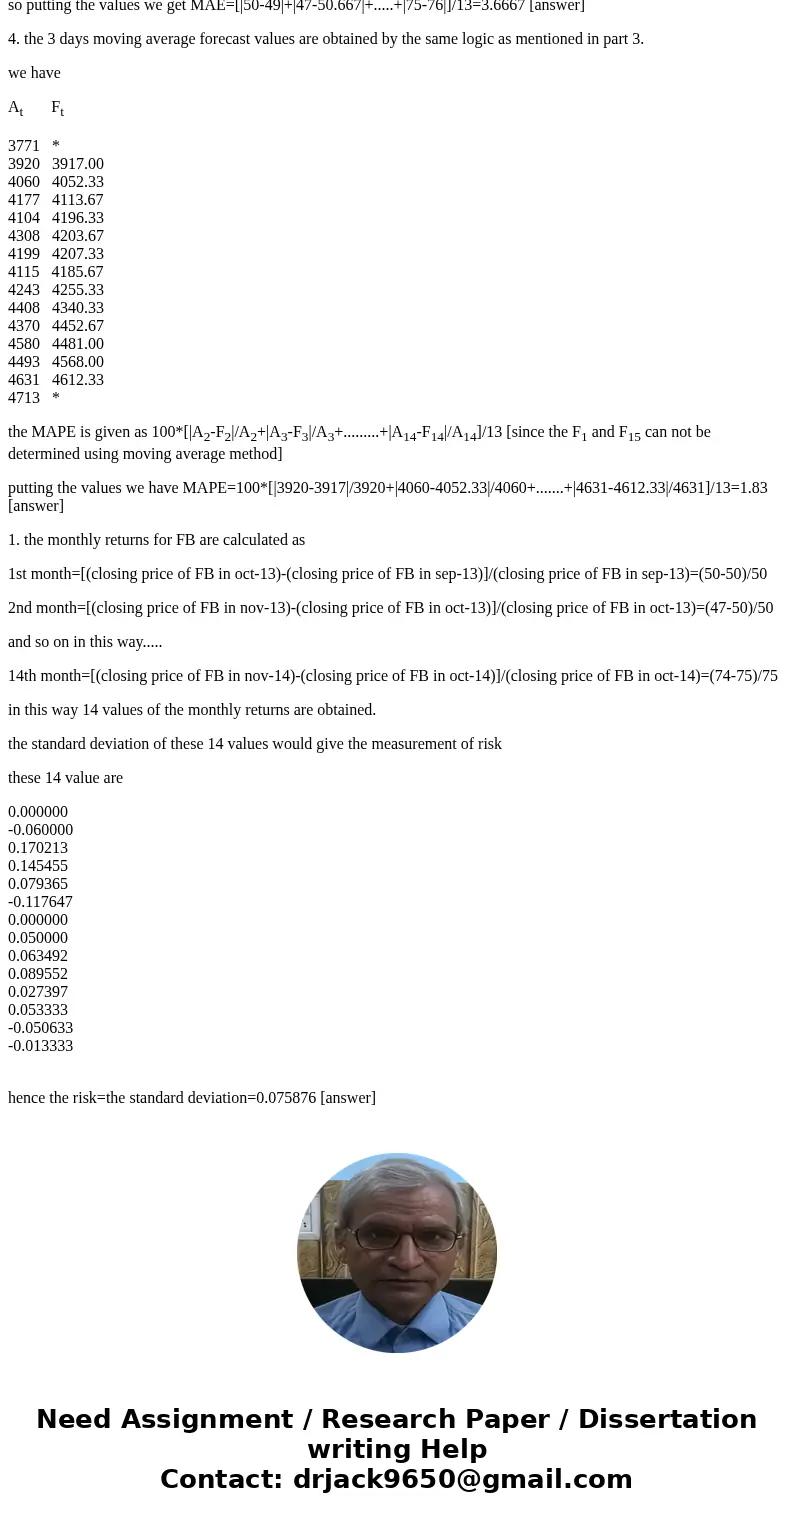
these 14 value are
0.000000
-0.060000
0.170213
0.145455
0.079365
-0.117647
0.000000
0.050000
0.063492
0.089552
0.027397
0.053333
-0.050633
-0.013333
hence the risk=the standard deviation=0.075876 [answer]


 Homework Sourse