Simon Companys yearend balance sheets follow 2017 2016 At De
Simon Company\'s year-end balance sheets follow 2017 2016 At December 31 Assets Cash Accounts receivable, net Merchandise inventory Prepaid expenses Plant assets, net Total assets Liabilities and Equity Accounts payable Long-term notes payable secured by $ 26,008 31,322 $ 31,978 40,981 44,977 3,484 192,180 $ 445,261 $ 383,846 $ 313,600 53,201 73,142 7,980 242,079218,201 73,855 94,774 8,545 $ 109,761 65,519 40,567 82,872 mortgages on plant assets Common stock, $10 par value Retained earnings 71,385 163,500 38,148 $ 445,261 $ 383,846 $ 313,600 86,519 163,500 163,500 68,308 89,128 Total liabilities and equity Express the balance sheets in common-size percents. (Do not round intermediate calculations and round your final percentage answers to 1 decimal place.)

Solution
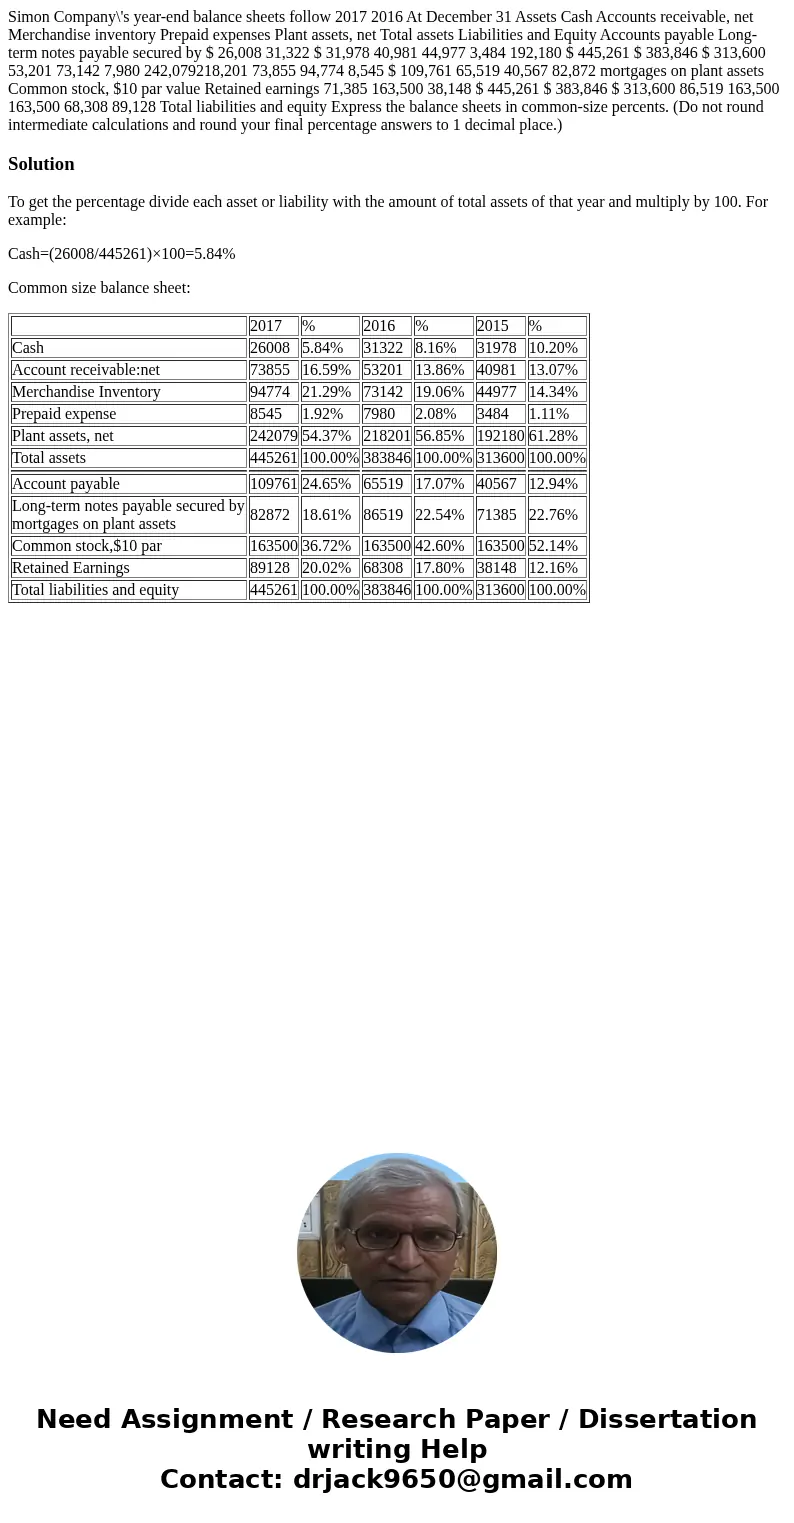
To get the percentage divide each asset or liability with the amount of total assets of that year and multiply by 100. For example:
Cash=(26008/445261)×100=5.84%
Common size balance sheet:
| 2017 | % | 2016 | % | 2015 | % | |
| Cash | 26008 | 5.84% | 31322 | 8.16% | 31978 | 10.20% |
| Account receivable:net | 73855 | 16.59% | 53201 | 13.86% | 40981 | 13.07% |
| Merchandise Inventory | 94774 | 21.29% | 73142 | 19.06% | 44977 | 14.34% |
| Prepaid expense | 8545 | 1.92% | 7980 | 2.08% | 3484 | 1.11% |
| Plant assets, net | 242079 | 54.37% | 218201 | 56.85% | 192180 | 61.28% |
| Total assets | 445261 | 100.00% | 383846 | 100.00% | 313600 | 100.00% |
| Account payable | 109761 | 24.65% | 65519 | 17.07% | 40567 | 12.94% |
| Long-term notes payable secured by mortgages on plant assets | 82872 | 18.61% | 86519 | 22.54% | 71385 | 22.76% |
| Common stock,$10 par | 163500 | 36.72% | 163500 | 42.60% | 163500 | 52.14% |
| Retained Earnings | 89128 | 20.02% | 68308 | 17.80% | 38148 | 12.16% |
| Total liabilities and equity | 445261 | 100.00% | 383846 | 100.00% | 313600 | 100.00% |

 Homework Sourse