A researcher is interested in the relationship between fathe
A researcher is interested in the relationship between fathers’ performance in high school and their children’s social skills. She obtains the high school transcripts of fathers and records their ending GPA. She then measures the social skills of their oldest child.
Use the data shown below to:
Calculate the Pearson r correlation coefficient.
Test for the significance of the correlation using a two-tailed test at the .05 level.
Show the scatterplot for the data.
Determine the coefficient of determination and explain what this means.
Determine the coefficient of alienation (non-determination) and explain what this means.
Explain to a friend what this correlation coefficient tells you about the relationship between fathers’ high school GPA and children’s social skills.
Explain to your friend what this correlation does not tell you about the relationship between these two variables. Suggest a third variable that may be at work here.
Determine the regression equation.
Predict the social skills level of a child whose father had a high school GPA of 2.10.
Predict the social skills level of a child whose father had a high school GPA of 3.40.
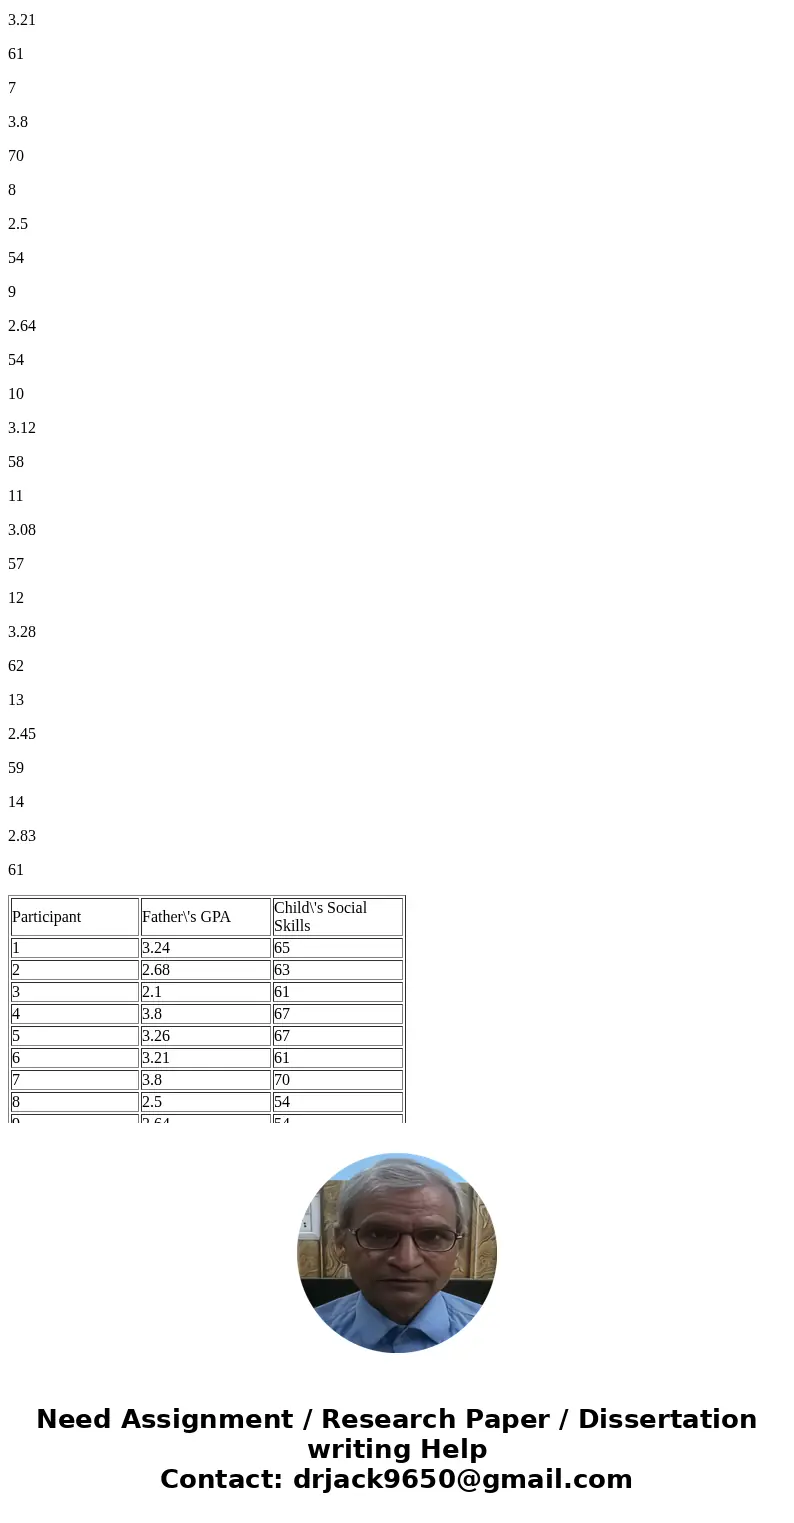
Participant
Father\'s GPA
Child\'s Social Skills
1
3.24
65
2
2.68
63
3
2.1
61
4
3.8
67
5
3.26
67
6
3.21
61
7
3.8
70
8
2.5
54
9
2.64
54
10
3.12
58
11
3.08
57
12
3.28
62
13
2.45
59
14
2.83
61
| Participant | Father\'s GPA | Child\'s Social Skills |
| 1 | 3.24 | 65 |
| 2 | 2.68 | 63 |
| 3 | 2.1 | 61 |
| 4 | 3.8 | 67 |
| 5 | 3.26 | 67 |
| 6 | 3.21 | 61 |
| 7 | 3.8 | 70 |
| 8 | 2.5 | 54 |
| 9 | 2.64 | 54 |
| 10 | 3.12 | 58 |
| 11 | 3.08 | 57 |
| 12 | 3.28 | 62 |
| 13 | 2.45 | 59 |
| 14 | 2.83 | 61 |
Solution
Let X be the fathers’ performance in high school.
Y be the their children’s social skills.
Calculate the Pearson r correlation coefficient.
The formual for r is,
r = nXY - (X)(Y) / sqrt( [ nX2 - (X)2 ] [ nY2 - (Y)2 ] )
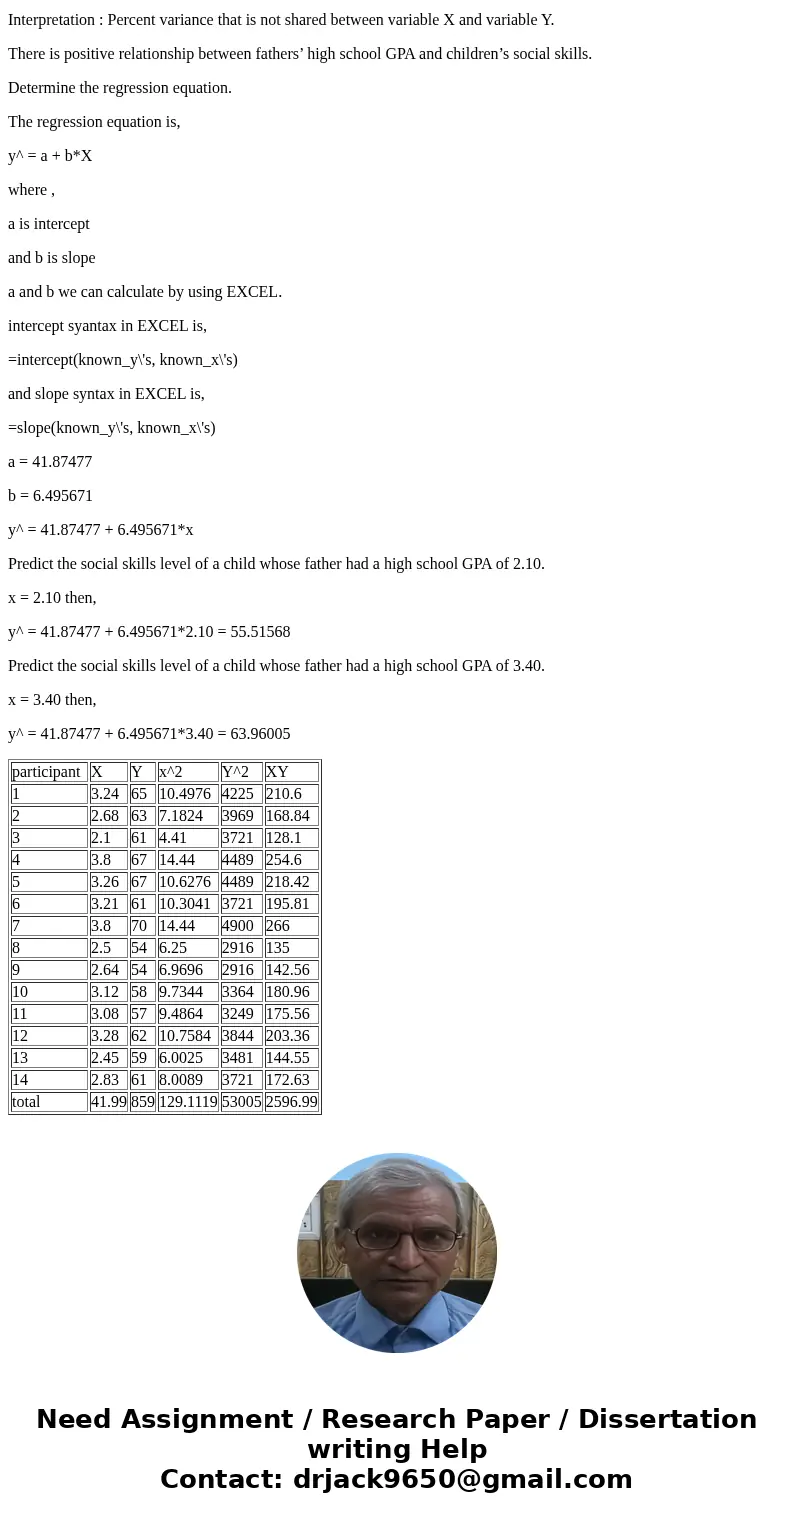
So here we need columns of summation of X, Y, X2, Y2 and XY.
n is number of data pairs = 14
r = (14 * 2596.99) - (41.99*859) / sqrt [ (14*129.1119 - 41.992 ) * (14*53005 - 8592 ) ]
r = 288.45 / sqrt [ 44.4065*4189 ]
r = 288.45 / 431.299
r = 0.668794
Test for the significance of the correlation using a two-tailed test at the .05 level.
Show the scatterplot for the data.
alpha = 0.05
Hypothesis for the test is,
H0 : rho = 0 Vs H1 : rho 0
We are given that the test is two tailed.
where rho is population correlation coefficient.
The test statistic is,
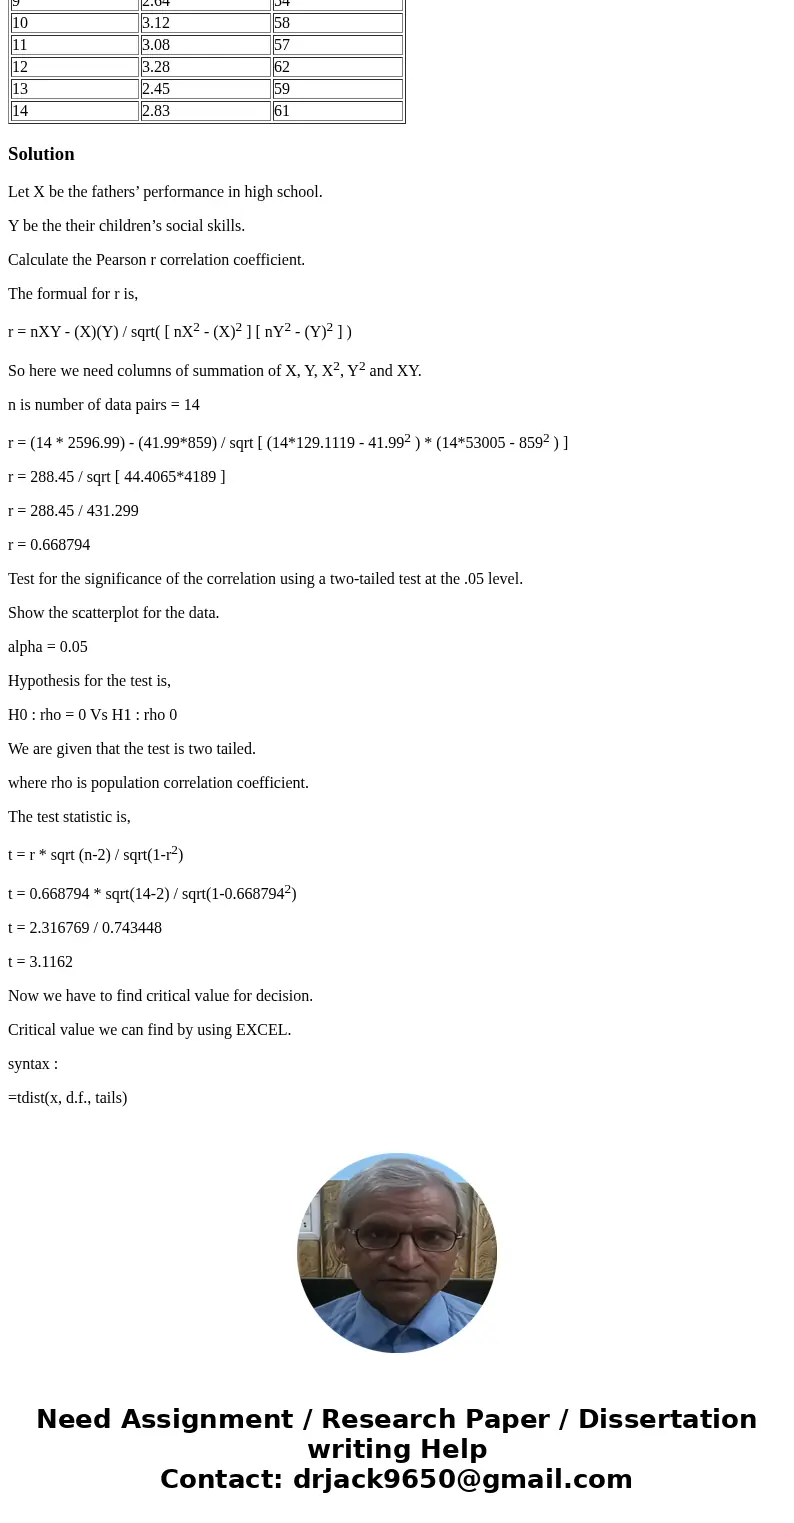
t = r * sqrt (n-2) / sqrt(1-r2)
t = 0.668794 * sqrt(14-2) / sqrt(1-0.6687942)
t = 2.316769 / 0.743448
t = 3.1162
Now we have to find critical value for decision.
Critical value we can find by using EXCEL.
syntax :
=tdist(x, d.f., tails)
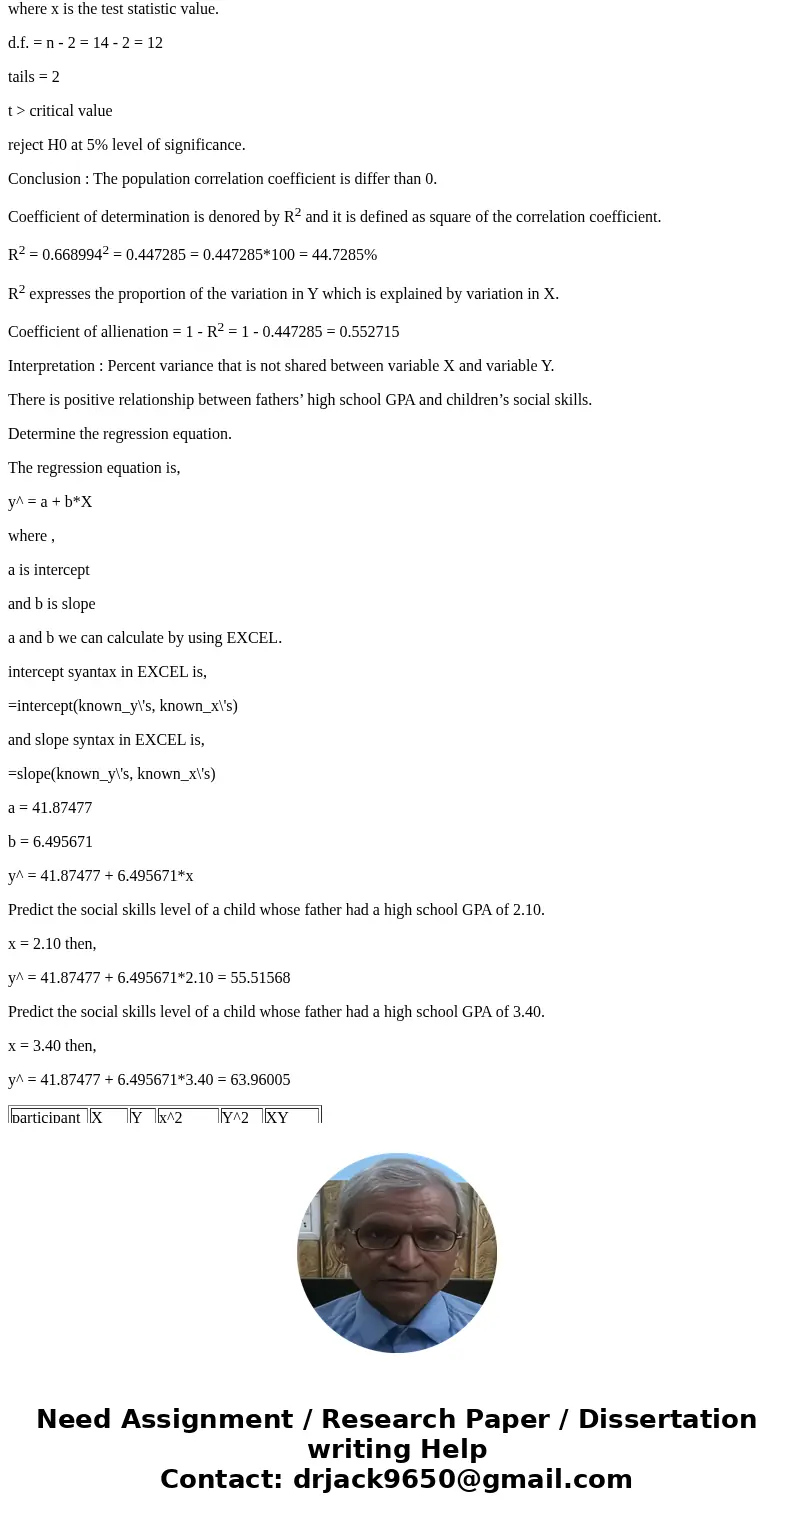
where x is the test statistic value.
d.f. = n - 2 = 14 - 2 = 12
tails = 2
t > critical value
reject H0 at 5% level of significance.
Conclusion : The population correlation coefficient is differ than 0.
Coefficient of determination is denored by R2 and it is defined as square of the correlation coefficient.
R2 = 0.6689942 = 0.447285 = 0.447285*100 = 44.7285%
R2 expresses the proportion of the variation in Y which is explained by variation in X.
Coefficient of allienation = 1 - R2 = 1 - 0.447285 = 0.552715
Interpretation : Percent variance that is not shared between variable X and variable Y.
There is positive relationship between fathers’ high school GPA and children’s social skills.
Determine the regression equation.
The regression equation is,
y^ = a + b*X
where ,
a is intercept
and b is slope
a and b we can calculate by using EXCEL.
intercept syantax in EXCEL is,
=intercept(known_y\'s, known_x\'s)
and slope syntax in EXCEL is,
=slope(known_y\'s, known_x\'s)
a = 41.87477
b = 6.495671
y^ = 41.87477 + 6.495671*x
Predict the social skills level of a child whose father had a high school GPA of 2.10.
x = 2.10 then,
y^ = 41.87477 + 6.495671*2.10 = 55.51568
Predict the social skills level of a child whose father had a high school GPA of 3.40.
x = 3.40 then,
y^ = 41.87477 + 6.495671*3.40 = 63.96005
| participant | X | Y | x^2 | Y^2 | XY |
| 1 | 3.24 | 65 | 10.4976 | 4225 | 210.6 |
| 2 | 2.68 | 63 | 7.1824 | 3969 | 168.84 |
| 3 | 2.1 | 61 | 4.41 | 3721 | 128.1 |
| 4 | 3.8 | 67 | 14.44 | 4489 | 254.6 |
| 5 | 3.26 | 67 | 10.6276 | 4489 | 218.42 |
| 6 | 3.21 | 61 | 10.3041 | 3721 | 195.81 |
| 7 | 3.8 | 70 | 14.44 | 4900 | 266 |
| 8 | 2.5 | 54 | 6.25 | 2916 | 135 |
| 9 | 2.64 | 54 | 6.9696 | 2916 | 142.56 |
| 10 | 3.12 | 58 | 9.7344 | 3364 | 180.96 |
| 11 | 3.08 | 57 | 9.4864 | 3249 | 175.56 |
| 12 | 3.28 | 62 | 10.7584 | 3844 | 203.36 |
| 13 | 2.45 | 59 | 6.0025 | 3481 | 144.55 |
| 14 | 2.83 | 61 | 8.0089 | 3721 | 172.63 |
| total | 41.99 | 859 | 129.1119 | 53005 | 2596.99 |

 Homework Sourse