Q2 and Q3 Infants even newborns prefer to look at attractive
Q2 and Q3: Infants, even newborns, prefer to look at attractive faces compared to less attractive faces (Slater, et al., 1998). In the study, infants from 1 to 6 days old were shown to photographs of women’s faces. Previously a group of adults had rated one of the faces as significantly more attractive than the other. The babies were positioned in front of a screen on which the photographs were presented. The pair of faces remained on the screen until the baby accumulated a total of 20 seconds of looking at one or the other. The number of seconds looking at the attractive face was recorded for each infant.
Q2) Use the dataset above to calculate each of the following statistics for “number of seconds spent looking at attractive face” (Show all work starting with formula):
a) Mean of the sample
b) Estimated standard deviation of the population
c) Standard error of the sampling distribution
Q3) Use the statistics calculated in Q2 to determine whether babies look significantly longer at attractive faces. If the babies had no preference (as stated by the null hypothesis), they would look at each face for 10 seconds. The psychologist must therefore rely on this population mean (Population Mean = 10) and estimates of the population standard deviation and sampling distribution to conduct a hypothesis test. Perform a hypothesis test with an alpha level of .05 and a two-tailed design (show all 5 steps of hypothesis testing).
| Number of Seconds Spent Looking at Attractive Face |
| 8 |
| 10 |
| 12 |
| 12 |
| 13 |
| 13 |
| 15 |
| 17 |
| 17 |
Solution
Q2.
Getting the mean, X,
X = Sum(x) / n
Sum(x) = 117
Thus,
X = 13 [mean]
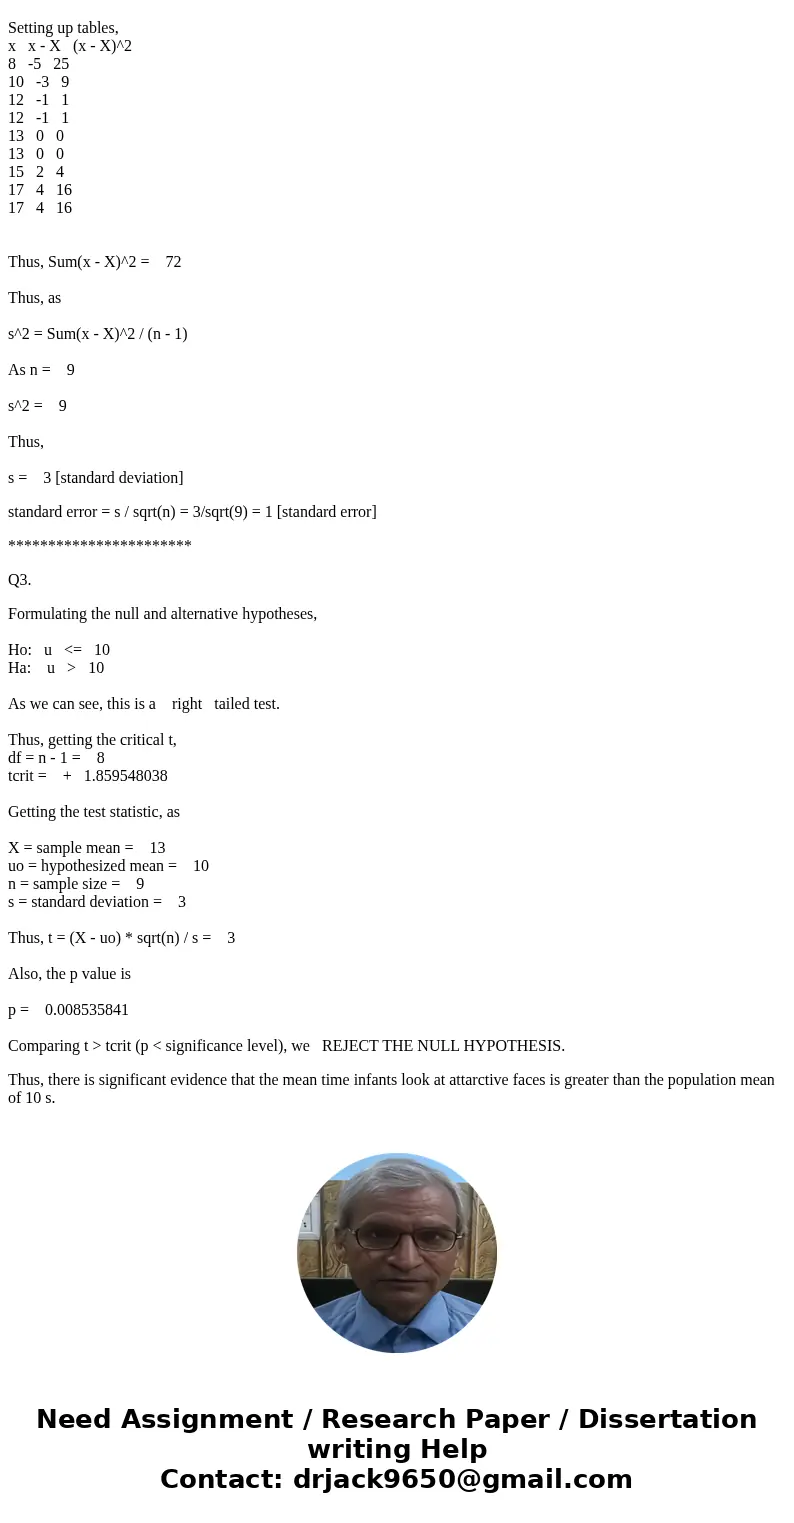
Setting up tables,
x x - X (x - X)^2
8 -5 25
10 -3 9
12 -1 1
12 -1 1
13 0 0
13 0 0
15 2 4
17 4 16
17 4 16
Thus, Sum(x - X)^2 = 72
Thus, as
s^2 = Sum(x - X)^2 / (n - 1)
As n = 9
s^2 = 9
Thus,
s = 3 [standard deviation]
standard error = s / sqrt(n) = 3/sqrt(9) = 1 [standard error]
***********************
Q3.
Formulating the null and alternative hypotheses,
Ho: u <= 10
Ha: u > 10
As we can see, this is a right tailed test.
Thus, getting the critical t,
df = n - 1 = 8
tcrit = + 1.859548038
Getting the test statistic, as
X = sample mean = 13
uo = hypothesized mean = 10
n = sample size = 9
s = standard deviation = 3
Thus, t = (X - uo) * sqrt(n) / s = 3
Also, the p value is
p = 0.008535841
Comparing t > tcrit (p < significance level), we REJECT THE NULL HYPOTHESIS.
Thus, there is significant evidence that the mean time infants look at attarctive faces is greater than the population mean of 10 s.


 Homework Sourse