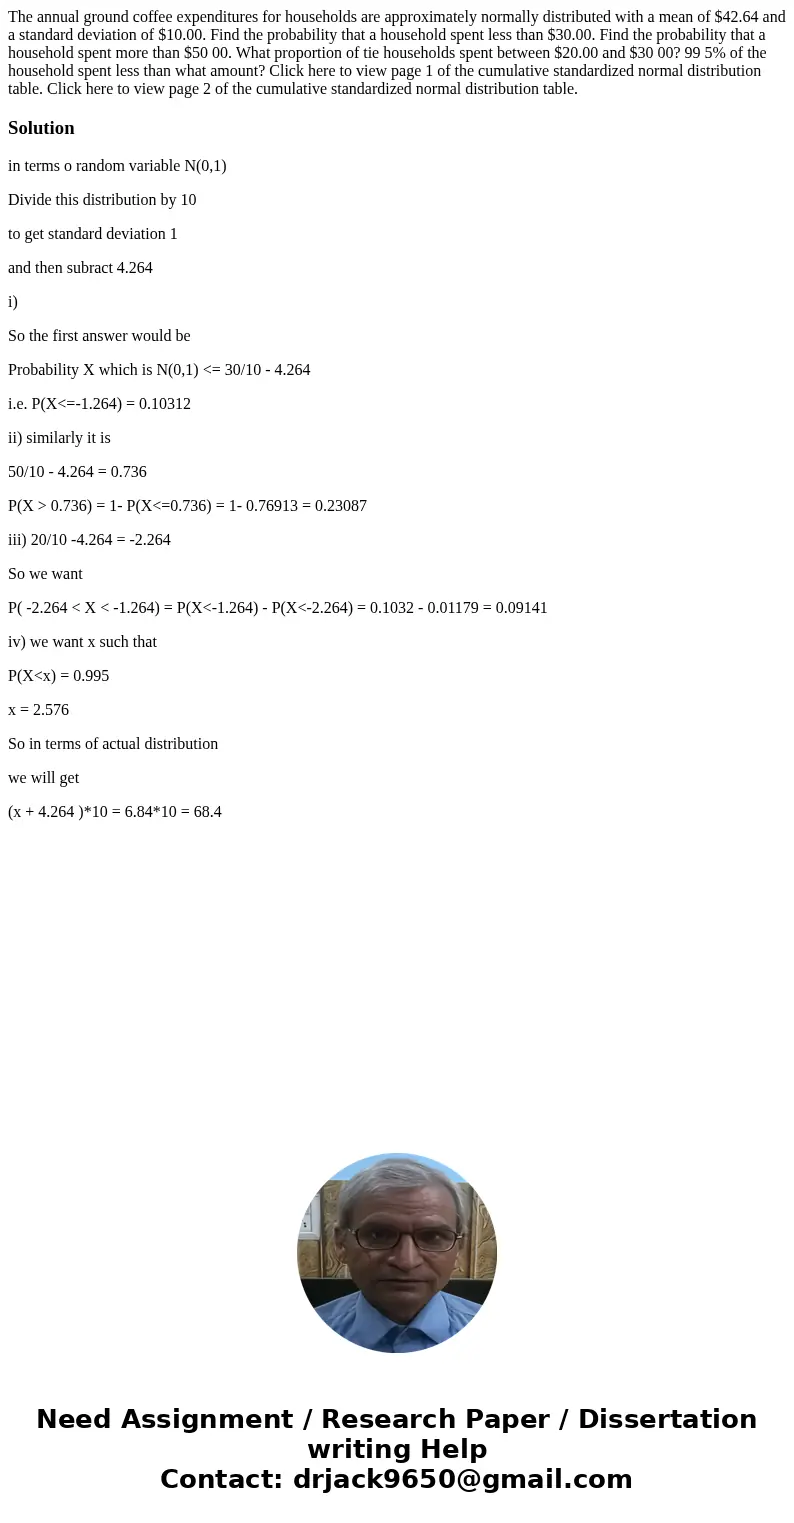
The annual ground coffee expenditures for households are app
The annual ground coffee expenditures for households are approximately normally distributed with a mean of $42.64 and a standard deviation of $10.00. Find the probability that a household spent less than $30.00. Find the probability that a household spent more than $50 00. What proportion of tie households spent between $20.00 and $30 00? 99 5% of the household spent less than what amount? Click here to view page 1 of the cumulative standardized normal distribution table. Click here to view page 2 of the cumulative standardized normal distribution table.
Solution
in terms o random variable N(0,1)
Divide this distribution by 10
to get standard deviation 1
and then subract 4.264
i)
So the first answer would be
Probability X which is N(0,1) <= 30/10 - 4.264
i.e. P(X<=-1.264) = 0.10312
ii) similarly it is
50/10 - 4.264 = 0.736
P(X > 0.736) = 1- P(X<=0.736) = 1- 0.76913 = 0.23087
iii) 20/10 -4.264 = -2.264
So we want
P( -2.264 < X < -1.264) = P(X<-1.264) - P(X<-2.264) = 0.1032 - 0.01179 = 0.09141
iv) we want x such that
P(X<x) = 0.995
x = 2.576
So in terms of actual distribution
we will get
(x + 4.264 )*10 = 6.84*10 = 68.4

 Homework Sourse