Consider the data on new orders for computers and electronic
Consider the data on new orders for computers and electronic products and the M1 money supply for the years 2011 through 2014.
Year
Month
New Orders for Computers and Electronic Products
M-1 Money Supply
2011
1
19222
1855.6
2011
2
20727
1874.7
2011
3
24893
1892.0
2011
4
19375
1897.8
2011
5
20152
1934.3
2011
6
25075
1947.0
2011
7
18615
2001.5
2011
8
21289
2112.9
2011
9
27014
2126.0
2011
10
22179
2137.4
2011
11
20761
2172.0
2011
12
27818
2168.2
2012
1
19447
2202.3
2012
2
23043
2212.2
2012
3
26734
2228.7
2012
4
21897
2245.3
2012
5
22403
2251.0
2012
6
24942
2262.3
2012
7
19365
2314.6
2012
8
20240
2346.5
2012
9
25478
2383.6
2012
10
20790
2415.5
2012
11
20362
2423.2
2012
12
27841
2457.7
2013
1
17393
2467.6
2013
2
18725
2470.4
2013
3
22919
2474.8
2013
4
19560
2511.0
2013
5
20333
2522.0
2013
6
24619
2517.9
2013
7
18065
2545.6
2013
8
18487
2557.3
2013
9
24877
2578.8
2013
10
20410
2620.2
2013
11
20194
2622.2
2013
12
24955
2654.5
Using the data for computer and electronic products, develop a two-period MA(2), four-period MA(4), and six-period MA(6) moving average forecasts.
Using the same data, develop a weighted moving average forecast where the weight of the most recent data (t-1) is 0.50, 0.25 for period (t-2), 0.15 for period (t-3), and 0.10 for period (t-4).
Using the same data, develop exponential smoothing forecasts with an alpha () of 0.85 and 0.15. Assume the first month forecast is the same as the actual data.
Using the same data, develop a time-series trend forecast using regression analysis.
Using the same data, develop a causal model forecast using the M1 Money Supply data as the independent variable.
Using either MSE or MAD, determine which forecast is best.
Develop a time series decomposition forecast for the computer and electronic products. You must first determine the seasonal (monthly indexes) and then divide the data by these indices. Then using the deseasonalized data, determine the trend. Finally, you must re-seasonalize the data.
| Year | Month | New Orders for Computers and Electronic Products | M-1 Money Supply |
| 2011 | 1 | 19222 | 1855.6 |
| 2011 | 2 | 20727 | 1874.7 |
| 2011 | 3 | 24893 | 1892.0 |
| 2011 | 4 | 19375 | 1897.8 |
| 2011 | 5 | 20152 | 1934.3 |
| 2011 | 6 | 25075 | 1947.0 |
| 2011 | 7 | 18615 | 2001.5 |
| 2011 | 8 | 21289 | 2112.9 |
| 2011 | 9 | 27014 | 2126.0 |
| 2011 | 10 | 22179 | 2137.4 |
| 2011 | 11 | 20761 | 2172.0 |
| 2011 | 12 | 27818 | 2168.2 |
| 2012 | 1 | 19447 | 2202.3 |
| 2012 | 2 | 23043 | 2212.2 |
| 2012 | 3 | 26734 | 2228.7 |
| 2012 | 4 | 21897 | 2245.3 |
| 2012 | 5 | 22403 | 2251.0 |
| 2012 | 6 | 24942 | 2262.3 |
| 2012 | 7 | 19365 | 2314.6 |
| 2012 | 8 | 20240 | 2346.5 |
| 2012 | 9 | 25478 | 2383.6 |
| 2012 | 10 | 20790 | 2415.5 |
| 2012 | 11 | 20362 | 2423.2 |
| 2012 | 12 | 27841 | 2457.7 |
| 2013 | 1 | 17393 | 2467.6 |
| 2013 | 2 | 18725 | 2470.4 |
| 2013 | 3 | 22919 | 2474.8 |
| 2013 | 4 | 19560 | 2511.0 |
| 2013 | 5 | 20333 | 2522.0 |
| 2013 | 6 | 24619 | 2517.9 |
| 2013 | 7 | 18065 | 2545.6 |
| 2013 | 8 | 18487 | 2557.3 |
| 2013 | 9 | 24877 | 2578.8 |
| 2013 | 10 | 20410 | 2620.2 |
| 2013 | 11 | 20194 | 2622.2 |
| 2013 | 12 | 24955 | 2654.5 |
Solution
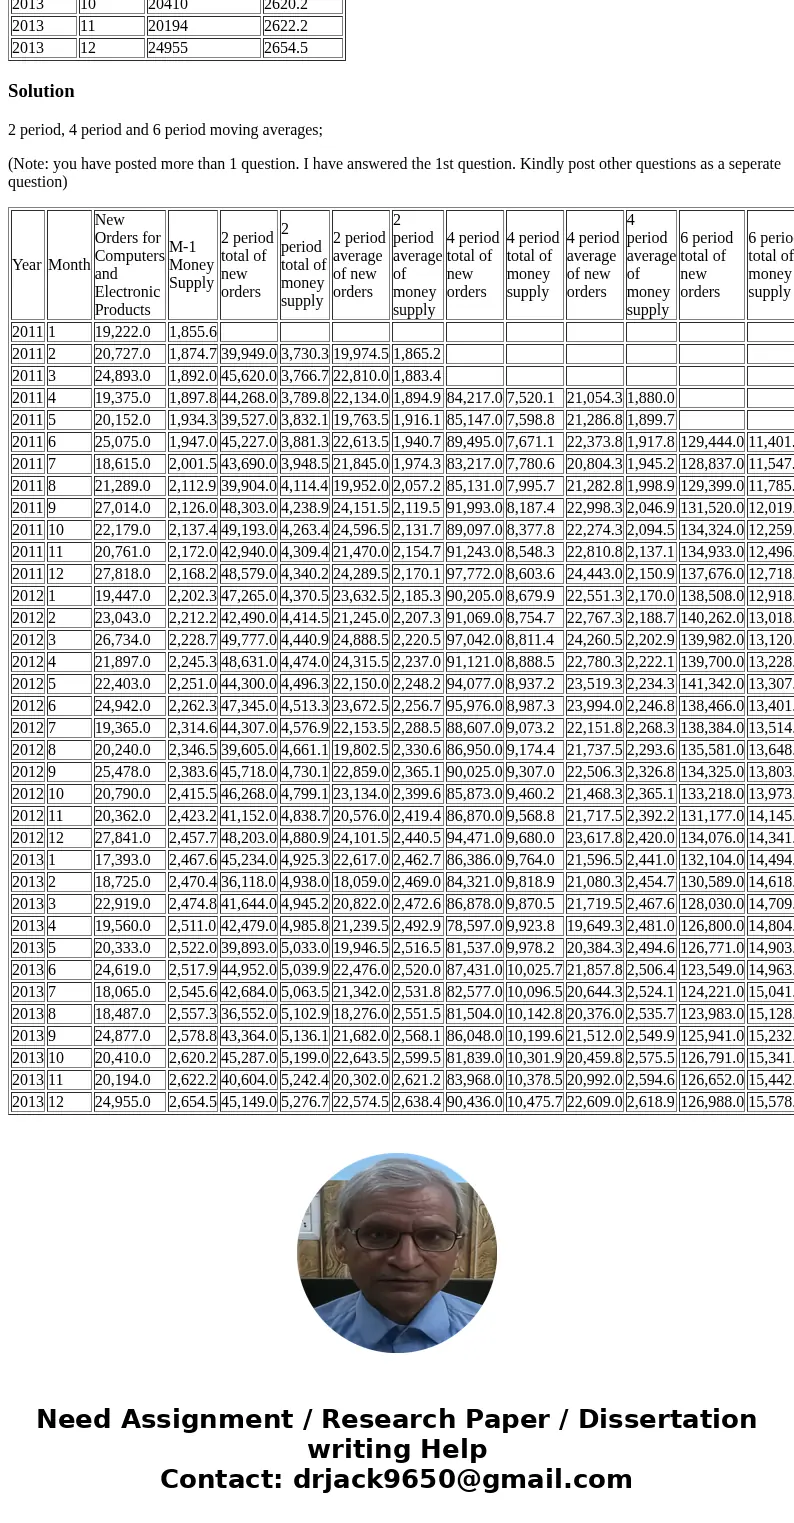
2 period, 4 period and 6 period moving averages;
(Note: you have posted more than 1 question. I have answered the 1st question. Kindly post other questions as a seperate question)
| Year | Month | New Orders for Computers and Electronic Products | M-1 Money Supply | 2 period total of new orders | 2 period total of money supply | 2 period average of new orders | 2 period average of money supply | 4 period total of new orders | 4 period total of money supply | 4 period average of new orders | 4 period average of money supply | 6 period total of new orders | 6 period total of money supply | 6 period average of new orders | 6 period average of money supply |
| 2011 | 1 | 19,222.0 | 1,855.6 | ||||||||||||
| 2011 | 2 | 20,727.0 | 1,874.7 | 39,949.0 | 3,730.3 | 19,974.5 | 1,865.2 | ||||||||
| 2011 | 3 | 24,893.0 | 1,892.0 | 45,620.0 | 3,766.7 | 22,810.0 | 1,883.4 | ||||||||
| 2011 | 4 | 19,375.0 | 1,897.8 | 44,268.0 | 3,789.8 | 22,134.0 | 1,894.9 | 84,217.0 | 7,520.1 | 21,054.3 | 1,880.0 | ||||
| 2011 | 5 | 20,152.0 | 1,934.3 | 39,527.0 | 3,832.1 | 19,763.5 | 1,916.1 | 85,147.0 | 7,598.8 | 21,286.8 | 1,899.7 | ||||
| 2011 | 6 | 25,075.0 | 1,947.0 | 45,227.0 | 3,881.3 | 22,613.5 | 1,940.7 | 89,495.0 | 7,671.1 | 22,373.8 | 1,917.8 | 129,444.0 | 11,401.4 | 21,574.0 | 1,900.2 |
| 2011 | 7 | 18,615.0 | 2,001.5 | 43,690.0 | 3,948.5 | 21,845.0 | 1,974.3 | 83,217.0 | 7,780.6 | 20,804.3 | 1,945.2 | 128,837.0 | 11,547.3 | 21,472.8 | 1,924.6 |
| 2011 | 8 | 21,289.0 | 2,112.9 | 39,904.0 | 4,114.4 | 19,952.0 | 2,057.2 | 85,131.0 | 7,995.7 | 21,282.8 | 1,998.9 | 129,399.0 | 11,785.5 | 21,566.5 | 1,964.3 |
| 2011 | 9 | 27,014.0 | 2,126.0 | 48,303.0 | 4,238.9 | 24,151.5 | 2,119.5 | 91,993.0 | 8,187.4 | 22,998.3 | 2,046.9 | 131,520.0 | 12,019.5 | 21,920.0 | 2,003.3 |
| 2011 | 10 | 22,179.0 | 2,137.4 | 49,193.0 | 4,263.4 | 24,596.5 | 2,131.7 | 89,097.0 | 8,377.8 | 22,274.3 | 2,094.5 | 134,324.0 | 12,259.1 | 22,387.3 | 2,043.2 |
| 2011 | 11 | 20,761.0 | 2,172.0 | 42,940.0 | 4,309.4 | 21,470.0 | 2,154.7 | 91,243.0 | 8,548.3 | 22,810.8 | 2,137.1 | 134,933.0 | 12,496.8 | 22,488.8 | 2,082.8 |
| 2011 | 12 | 27,818.0 | 2,168.2 | 48,579.0 | 4,340.2 | 24,289.5 | 2,170.1 | 97,772.0 | 8,603.6 | 24,443.0 | 2,150.9 | 137,676.0 | 12,718.0 | 22,946.0 | 2,119.7 |
| 2012 | 1 | 19,447.0 | 2,202.3 | 47,265.0 | 4,370.5 | 23,632.5 | 2,185.3 | 90,205.0 | 8,679.9 | 22,551.3 | 2,170.0 | 138,508.0 | 12,918.8 | 23,084.7 | 2,153.1 |
| 2012 | 2 | 23,043.0 | 2,212.2 | 42,490.0 | 4,414.5 | 21,245.0 | 2,207.3 | 91,069.0 | 8,754.7 | 22,767.3 | 2,188.7 | 140,262.0 | 13,018.1 | 23,377.0 | 2,169.7 |
| 2012 | 3 | 26,734.0 | 2,228.7 | 49,777.0 | 4,440.9 | 24,888.5 | 2,220.5 | 97,042.0 | 8,811.4 | 24,260.5 | 2,202.9 | 139,982.0 | 13,120.8 | 23,330.3 | 2,186.8 |
| 2012 | 4 | 21,897.0 | 2,245.3 | 48,631.0 | 4,474.0 | 24,315.5 | 2,237.0 | 91,121.0 | 8,888.5 | 22,780.3 | 2,222.1 | 139,700.0 | 13,228.7 | 23,283.3 | 2,204.8 |
| 2012 | 5 | 22,403.0 | 2,251.0 | 44,300.0 | 4,496.3 | 22,150.0 | 2,248.2 | 94,077.0 | 8,937.2 | 23,519.3 | 2,234.3 | 141,342.0 | 13,307.7 | 23,557.0 | 2,218.0 |
| 2012 | 6 | 24,942.0 | 2,262.3 | 47,345.0 | 4,513.3 | 23,672.5 | 2,256.7 | 95,976.0 | 8,987.3 | 23,994.0 | 2,246.8 | 138,466.0 | 13,401.8 | 23,077.7 | 2,233.6 |
| 2012 | 7 | 19,365.0 | 2,314.6 | 44,307.0 | 4,576.9 | 22,153.5 | 2,288.5 | 88,607.0 | 9,073.2 | 22,151.8 | 2,268.3 | 138,384.0 | 13,514.1 | 23,064.0 | 2,252.4 |
| 2012 | 8 | 20,240.0 | 2,346.5 | 39,605.0 | 4,661.1 | 19,802.5 | 2,330.6 | 86,950.0 | 9,174.4 | 21,737.5 | 2,293.6 | 135,581.0 | 13,648.4 | 22,596.8 | 2,274.7 |
| 2012 | 9 | 25,478.0 | 2,383.6 | 45,718.0 | 4,730.1 | 22,859.0 | 2,365.1 | 90,025.0 | 9,307.0 | 22,506.3 | 2,326.8 | 134,325.0 | 13,803.3 | 22,387.5 | 2,300.6 |
| 2012 | 10 | 20,790.0 | 2,415.5 | 46,268.0 | 4,799.1 | 23,134.0 | 2,399.6 | 85,873.0 | 9,460.2 | 21,468.3 | 2,365.1 | 133,218.0 | 13,973.5 | 22,203.0 | 2,328.9 |
| 2012 | 11 | 20,362.0 | 2,423.2 | 41,152.0 | 4,838.7 | 20,576.0 | 2,419.4 | 86,870.0 | 9,568.8 | 21,717.5 | 2,392.2 | 131,177.0 | 14,145.7 | 21,862.8 | 2,357.6 |
| 2012 | 12 | 27,841.0 | 2,457.7 | 48,203.0 | 4,880.9 | 24,101.5 | 2,440.5 | 94,471.0 | 9,680.0 | 23,617.8 | 2,420.0 | 134,076.0 | 14,341.1 | 22,346.0 | 2,390.2 |
| 2013 | 1 | 17,393.0 | 2,467.6 | 45,234.0 | 4,925.3 | 22,617.0 | 2,462.7 | 86,386.0 | 9,764.0 | 21,596.5 | 2,441.0 | 132,104.0 | 14,494.1 | 22,017.3 | 2,415.7 |
| 2013 | 2 | 18,725.0 | 2,470.4 | 36,118.0 | 4,938.0 | 18,059.0 | 2,469.0 | 84,321.0 | 9,818.9 | 21,080.3 | 2,454.7 | 130,589.0 | 14,618.0 | 21,764.8 | 2,436.3 |
| 2013 | 3 | 22,919.0 | 2,474.8 | 41,644.0 | 4,945.2 | 20,822.0 | 2,472.6 | 86,878.0 | 9,870.5 | 21,719.5 | 2,467.6 | 128,030.0 | 14,709.2 | 21,338.3 | 2,451.5 |
| 2013 | 4 | 19,560.0 | 2,511.0 | 42,479.0 | 4,985.8 | 21,239.5 | 2,492.9 | 78,597.0 | 9,923.8 | 19,649.3 | 2,481.0 | 126,800.0 | 14,804.7 | 21,133.3 | 2,467.5 |
| 2013 | 5 | 20,333.0 | 2,522.0 | 39,893.0 | 5,033.0 | 19,946.5 | 2,516.5 | 81,537.0 | 9,978.2 | 20,384.3 | 2,494.6 | 126,771.0 | 14,903.5 | 21,128.5 | 2,483.9 |
| 2013 | 6 | 24,619.0 | 2,517.9 | 44,952.0 | 5,039.9 | 22,476.0 | 2,520.0 | 87,431.0 | 10,025.7 | 21,857.8 | 2,506.4 | 123,549.0 | 14,963.7 | 20,591.5 | 2,494.0 |
| 2013 | 7 | 18,065.0 | 2,545.6 | 42,684.0 | 5,063.5 | 21,342.0 | 2,531.8 | 82,577.0 | 10,096.5 | 20,644.3 | 2,524.1 | 124,221.0 | 15,041.7 | 20,703.5 | 2,507.0 |
| 2013 | 8 | 18,487.0 | 2,557.3 | 36,552.0 | 5,102.9 | 18,276.0 | 2,551.5 | 81,504.0 | 10,142.8 | 20,376.0 | 2,535.7 | 123,983.0 | 15,128.6 | 20,663.8 | 2,521.4 |
| 2013 | 9 | 24,877.0 | 2,578.8 | 43,364.0 | 5,136.1 | 21,682.0 | 2,568.1 | 86,048.0 | 10,199.6 | 21,512.0 | 2,549.9 | 125,941.0 | 15,232.6 | 20,990.2 | 2,538.8 |
| 2013 | 10 | 20,410.0 | 2,620.2 | 45,287.0 | 5,199.0 | 22,643.5 | 2,599.5 | 81,839.0 | 10,301.9 | 20,459.8 | 2,575.5 | 126,791.0 | 15,341.8 | 21,131.8 | 2,557.0 |
| 2013 | 11 | 20,194.0 | 2,622.2 | 40,604.0 | 5,242.4 | 20,302.0 | 2,621.2 | 83,968.0 | 10,378.5 | 20,992.0 | 2,594.6 | 126,652.0 | 15,442.0 | 21,108.7 | 2,573.7 |
| 2013 | 12 | 24,955.0 | 2,654.5 | 45,149.0 | 5,276.7 | 22,574.5 | 2,638.4 | 90,436.0 | 10,475.7 | 22,609.0 | 2,618.9 | 126,988.0 | 15,578.6 | 21,164.7 | 2,596.4 |


 Homework Sourse