The table below contains recent data Y is quarterly real GDP
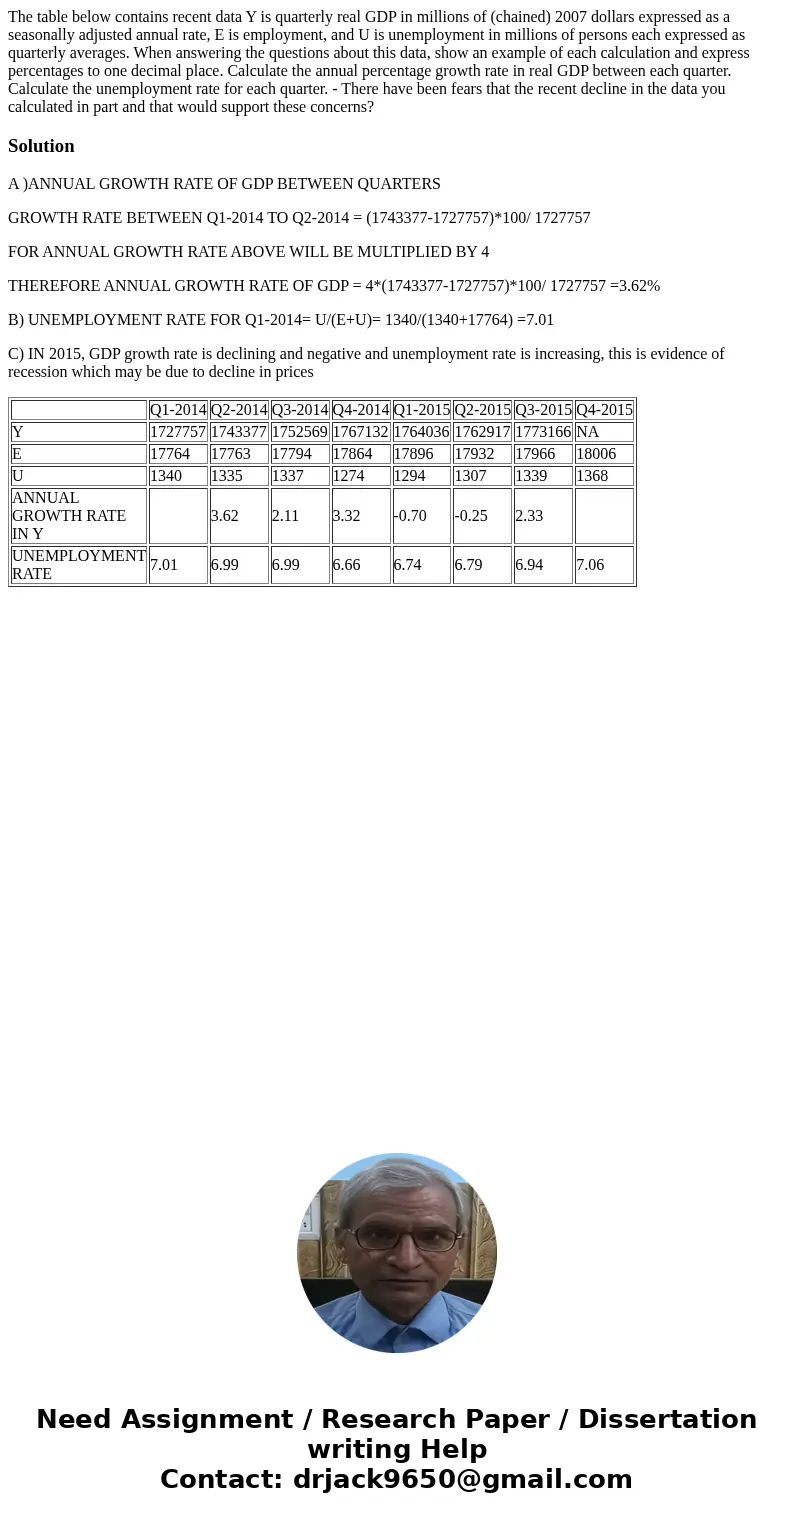
The table below contains recent data Y is quarterly real GDP in millions of (chained) 2007 dollars expressed as a seasonally adjusted annual rate, E is employment, and U is unemployment in millions of persons each expressed as quarterly averages. When answering the questions about this data, show an example of each calculation and express percentages to one decimal place. Calculate the annual percentage growth rate in real GDP between each quarter. Calculate the unemployment rate for each quarter. - There have been fears that the recent decline in the data you calculated in part and that would support these concerns?

Solution
A )ANNUAL GROWTH RATE OF GDP BETWEEN QUARTERS
GROWTH RATE BETWEEN Q1-2014 TO Q2-2014 = (1743377-1727757)*100/ 1727757
FOR ANNUAL GROWTH RATE ABOVE WILL BE MULTIPLIED BY 4
THEREFORE ANNUAL GROWTH RATE OF GDP = 4*(1743377-1727757)*100/ 1727757 =3.62%
B) UNEMPLOYMENT RATE FOR Q1-2014= U/(E+U)= 1340/(1340+17764) =7.01
C) IN 2015, GDP growth rate is declining and negative and unemployment rate is increasing, this is evidence of recession which may be due to decline in prices
| Q1-2014 | Q2-2014 | Q3-2014 | Q4-2014 | Q1-2015 | Q2-2015 | Q3-2015 | Q4-2015 | |
| Y | 1727757 | 1743377 | 1752569 | 1767132 | 1764036 | 1762917 | 1773166 | NA |
| E | 17764 | 17763 | 17794 | 17864 | 17896 | 17932 | 17966 | 18006 |
| U | 1340 | 1335 | 1337 | 1274 | 1294 | 1307 | 1339 | 1368 |
| ANNUAL GROWTH RATE IN Y | 3.62 | 2.11 | 3.32 | -0.70 | -0.25 | 2.33 | ||
| UNEMPLOYMENT RATE | 7.01 | 6.99 | 6.99 | 6.66 | 6.74 | 6.79 | 6.94 | 7.06 |

 Homework Sourse