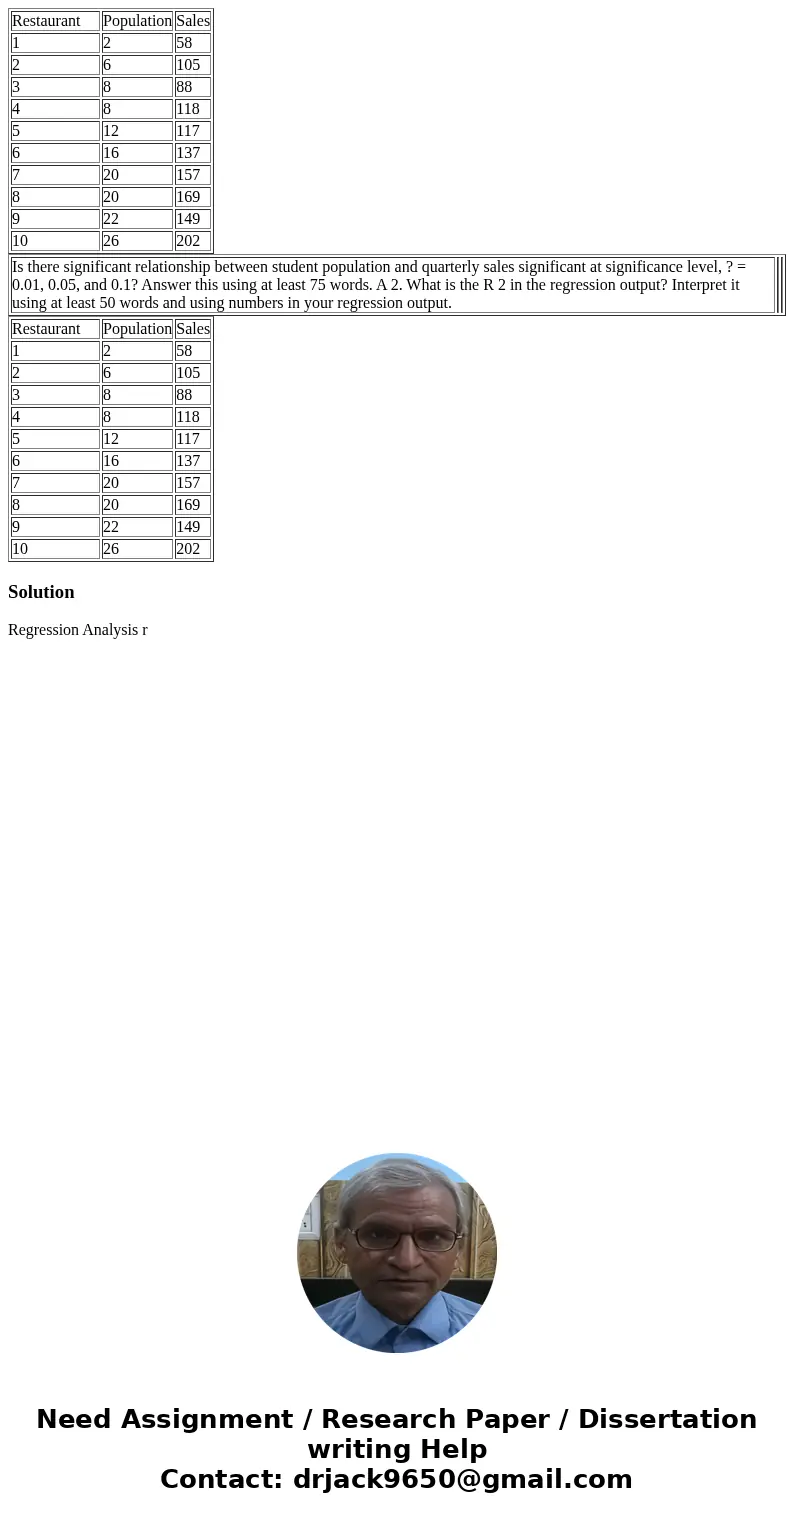
Restaurant Population Sales 1 2 58 2 6 105 3 8 88 4 8 118 5
| Restaurant | Population | Sales |
| 1 | 2 | 58 |
| 2 | 6 | 105 |
| 3 | 8 | 88 |
| 4 | 8 | 118 |
| 5 | 12 | 117 |
| 6 | 16 | 137 |
| 7 | 20 | 157 |
| 8 | 20 | 169 |
| 9 | 22 | 149 |
| 10 | 26 | 202 |
| Is there significant relationship between student population and quarterly sales significant at significance level, ? = 0.01, 0.05, and 0.1? Answer this using at least 75 words. A 2. What is the R 2 in the regression output? Interpret it using at least 50 words and using numbers in your regression output. |
| Restaurant | Population | Sales |
| 1 | 2 | 58 |
| 2 | 6 | 105 |
| 3 | 8 | 88 |
| 4 | 8 | 118 |
| 5 | 12 | 117 |
| 6 | 16 | 137 |
| 7 | 20 | 157 |
| 8 | 20 | 169 |
| 9 | 22 | 149 |
| 10 | 26 | 202 |
Solution
Regression Analysis r
 Homework Sourse