calculate upper and lower control limits determine whether t
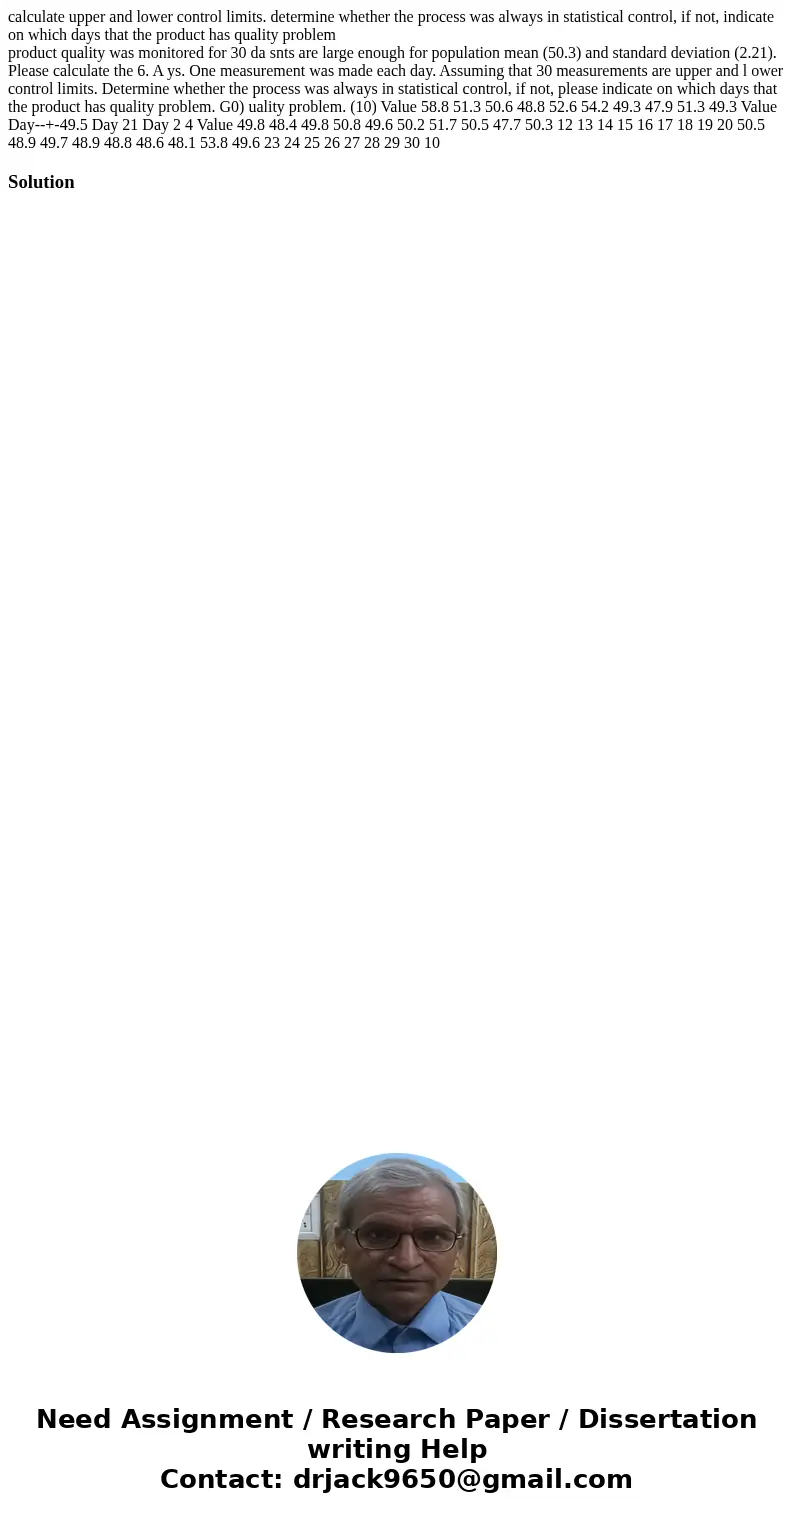
calculate upper and lower control limits. determine whether the process was always in statistical control, if not, indicate on which days that the product has quality problem
product quality was monitored for 30 da snts are large enough for population mean (50.3) and standard deviation (2.21). Please calculate the 6. A ys. One measurement was made each day. Assuming that 30 measurements are upper and l ower control limits. Determine whether the process was always in statistical control, if not, please indicate on which days that the product has quality problem. G0) uality problem. (10) Value 58.8 51.3 50.6 48.8 52.6 54.2 49.3 47.9 51.3 49.3 Value Day--+-49.5 Day 21 Day 2 4 Value 49.8 48.4 49.8 50.8 49.6 50.2 51.7 50.5 47.7 50.3 12 13 14 15 16 17 18 19 20 50.5 48.9 49.7 48.9 48.8 48.6 48.1 53.8 49.6 23 24 25 26 27 28 29 30 10 Solution

 Homework Sourse